
Whitepaper Adjacencies
The Adjacency method is based on a similar philosophy to the Ansoff matrix, but uses additional criteria. While the Ansoff matrix works with the dimensions product and market, the Adjacency method focuses on the dimensions distance to the core business and distance to success.
For the distance to the core business we take the two Ansoff criteria market and product and add the criteria technology, sales channel, regions, value chain (forward and backward integration) and applications.
For the dimension of distance to success, we work with criteria such as the level of necessary investment or duration until the first turnover.
Since the risk, and thus the probability of failure, increases with the distance to the existing business, the following rules apply:
- Develop new businesses in neighboring (adjacent) areas
- Do not develop new businesses in more than one dimension at the same time (for Ansoff, that would be diversification)
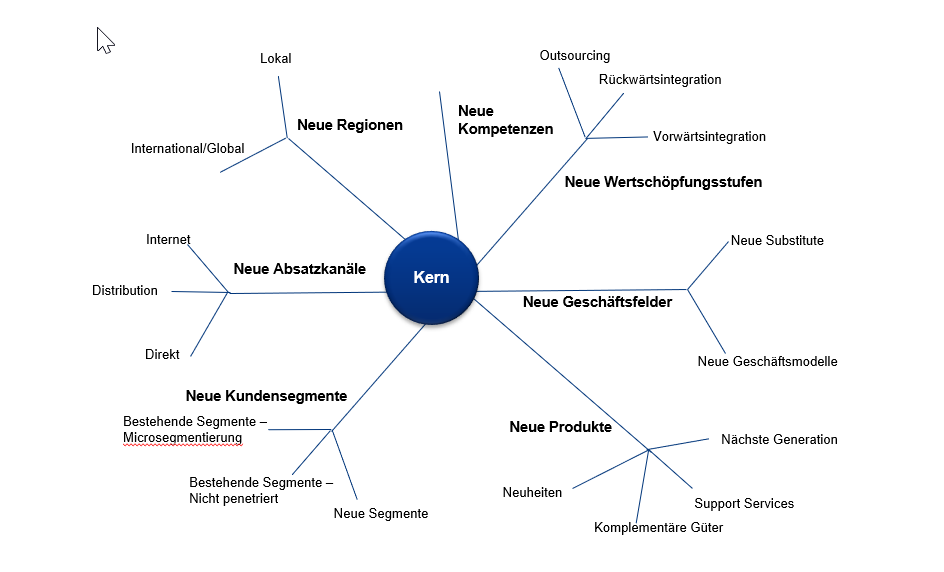
Figure 1: Expansion of the core business in multiple dimensions
The procedure is organized in the following steps:
- Definition of the core business
- Defining the criteria for the distance from the core business (Adjacency)
- Definition of criteria for the distance to success
- Development of strategic options (the marketplace method is suitable for this)
- Rating of adjacencies and distance to success for each strategic option
- Calculating the Adjacency Portfolio (see Excel Tool)
- Selection of options and development of strategic directions
Procedure:
1. Definition of the core business
In a first step, the core business is defined by the description of the business segments. You will find instructions on how to do this in the two whitepapers «Business Segment Structure» and «Business Segment Description».
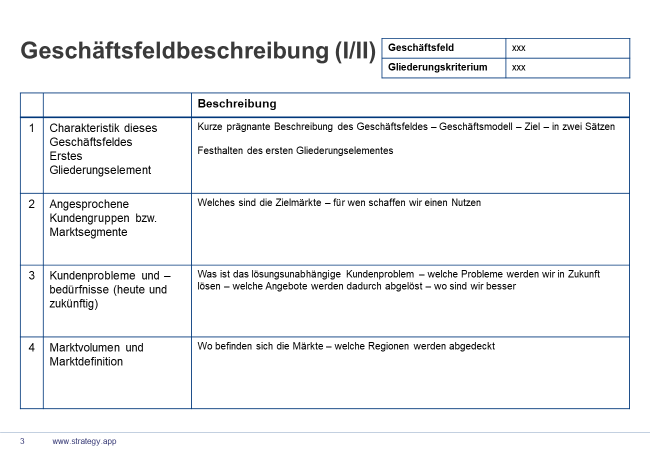
Figure 2: Business Field Description
2. Defining the criteria for the distance from the core business (Adjacency)
The criteria market / customer groups, products, technologies, sales channels and regions help us to measure the distance to our core business. If all are the same, we remain in our core business – the more of them are different, the further we move into new areas of business.
These criteria must be discussed, precisely defined and provided with a scale of values, e.g. with values from 1 to 3, which indicate the distance from the core business.
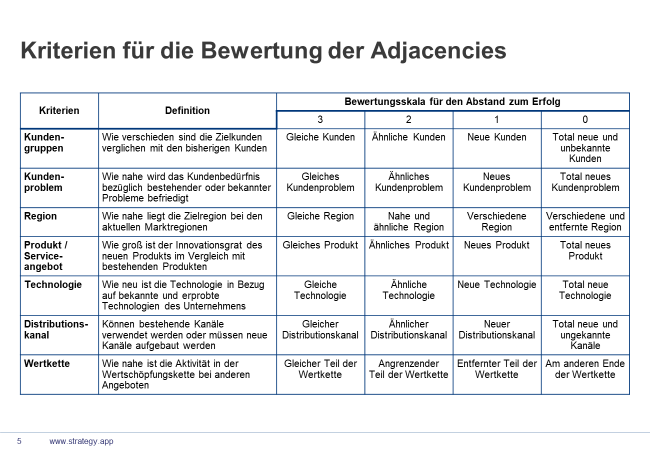
Figure 3: Definition of criteria for the dimension Adjacency
3. Definition of criteria for distance to success
Here we propose the following six criteria: Market size – Sales – Time to first sales – Competition – Substitution of existing products – Investments
These criteria should also be discussed, defined and provided with a scale of values, e.g. the expected market volume is evaluated with figures from 1 to 3.
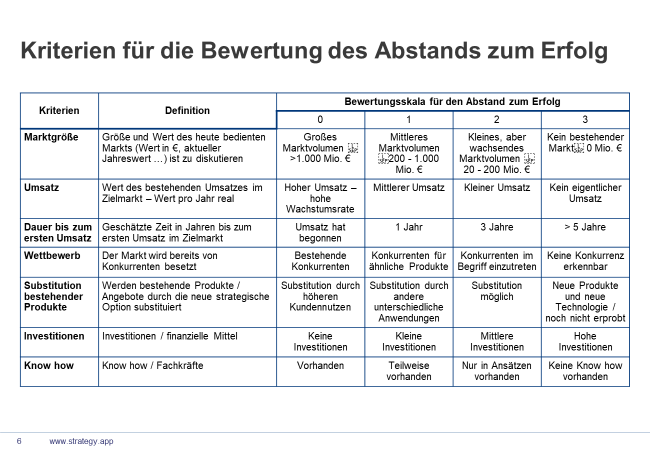
Figure 4: Description of the criteria for the distance to success
4. Developing Strategic Options
For the elaboration and compilation of strategic options and directions, we recommend the «Marketplace» method (we will also provide a whitepaper on this shortly). However, other methods can also be used here, such as brainstorming or systematic derivation from SWOT analysis. Or we can use simple forms to search for potentials in any direction (dimension).
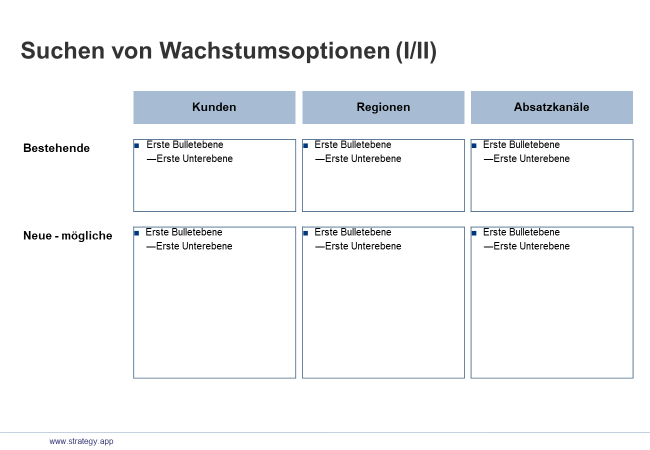
Figure 5: Developing strategic options
5. Assessment of adjacencies and distance to success for each strategic option
For each idea or option, the distance to the core business and the distance to success are evaluated based on the given criteria. A brief description of the discussion will help with later use or revision.
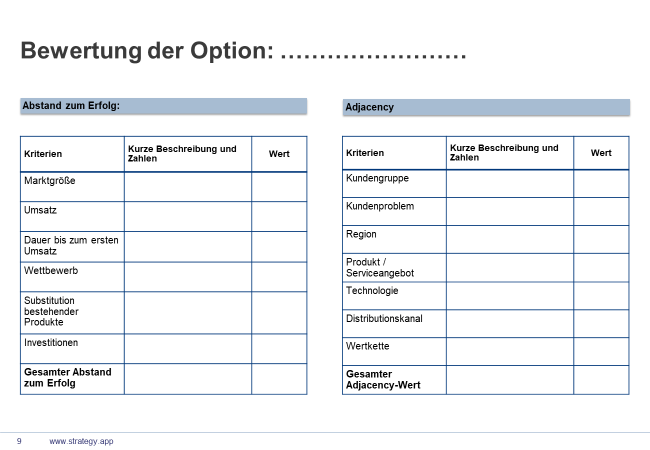
Figure 6: Assessment of the strategic options
6. Calculating the Adjacency Portfolio (see Excel Tool)
We provide you with an Excel tool for calculating the portfolio. The result shows at a glance the risk positions of the individual options, from the expansion of the core business to diversification which is totally different from the existing business.
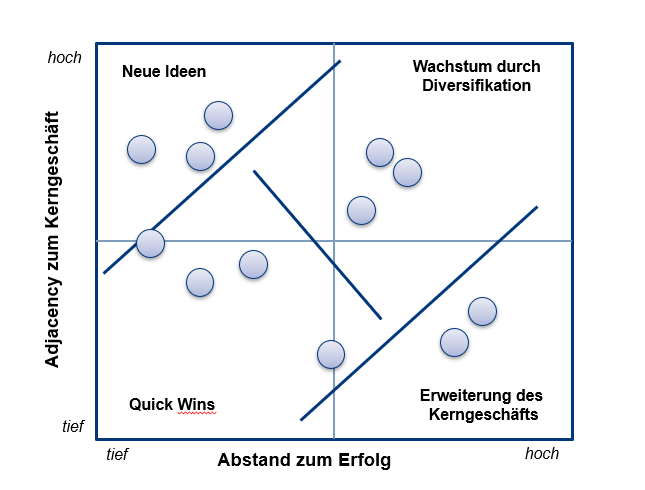
Figure 7: Rating of options (Excel tool or directly in STRATEGY.APP)
7. Selection of options and description of strategic directions
The risk portfolio can be used to divide up and prioritise the strategy directions.
The matrix can be roughly divided into 4 fields:
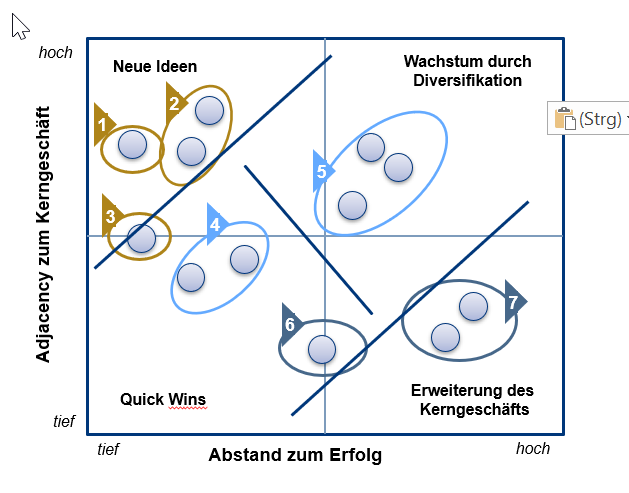
- Close to the core business and close to success (bottom left):
- These are the Quick-Wins. They can be implemented quickly and are in the core business. Often these are not big strategies, but rather immediate measures.
- Close to the core business, but big distance to success (bottom right):
- This is the strategic expansion of the core business. New, partly large and therefore strategic investments in the existing business. This includes, for example, the construction of a new factory.
- Far from the core business with a small distance to success (top left):
- These are often ideas for new business in the form of tests or pilot projects. Sometimes the effort is simply underestimated here. Nevertheless, it may be useful to launch targeted experiments or to try something without investing too much. This allows the risk to be kept under control.
- Far from the core business with a big distance to success (top right):
- This is real diversification. This not only involves a high risk, but also has a considerable cost. We recommend that you take another close look at these options and only tackle them after weighing up all the risks and arguments.
The preparation of a business plan and a risk assessment can now be built on this basis.
Assessment of strategic options with Adjacency in STRATEGY.APP
In STRATEGY.APP, the criteria for the Adjacencies tool are set in the parameters for the instruments:
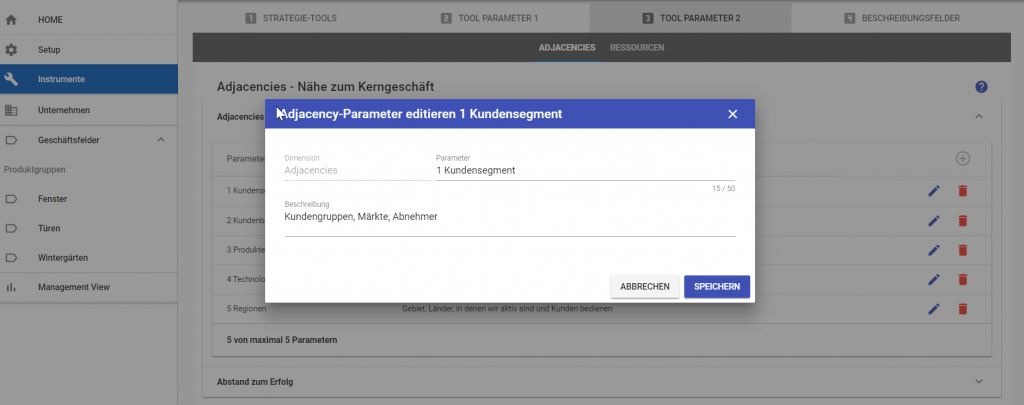
Figure 9: Input of the parameters for Adjacency
The strategic options that we have developed are therefore evaluated individually:
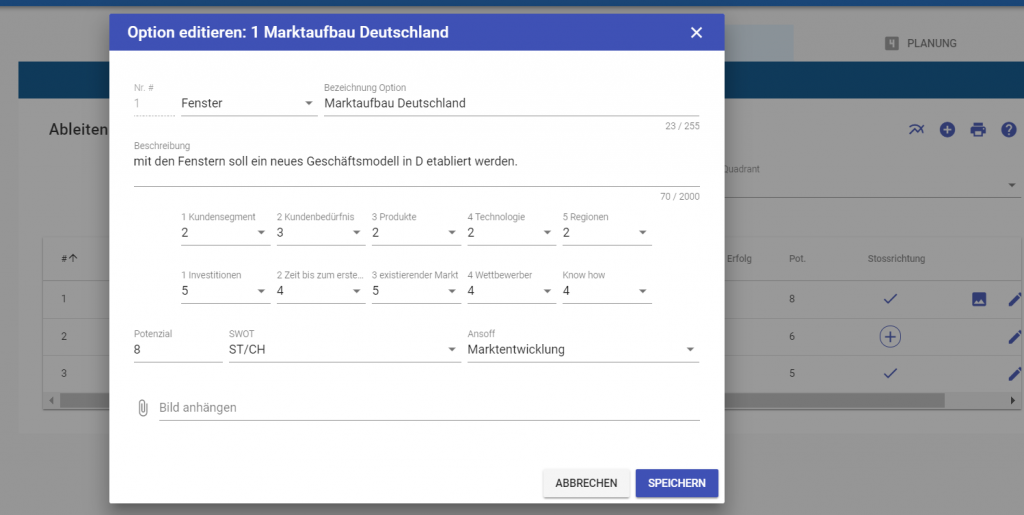
Figure 10: Rating of the individual options
The evaluation shows the position of the options on the adjacency matrix:
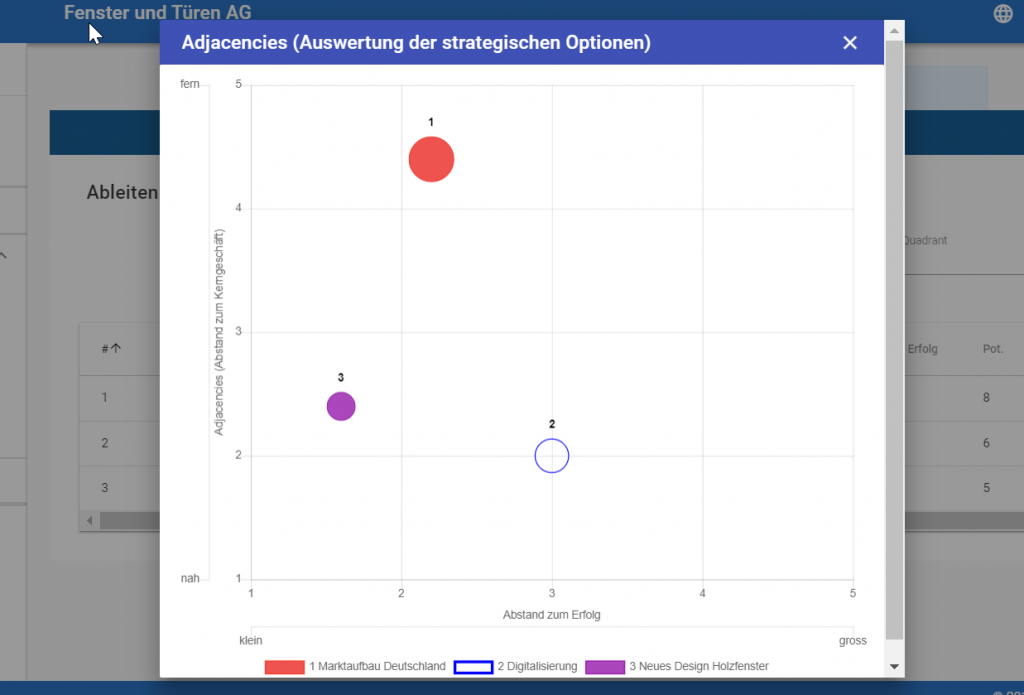
Figure 11: Position of the options on the adjacency matrix
Then the options for further processing are selected and described and quantified as strategic directions.
Note: Agility
Here is a note on the subject of agility: STRATEGY.APP allows new options to be added at any time, and new directions to be created from the options. On the other hand, running strategic directions can be stopped or reset at any time. The business plan and the measures are then automatically adjusted or removed. This makes it possible to react to changes in the environment at any time.
We have prepared a practical tool (xls) and a template for PowerPoint for you to download:
Download Adjacenciy example (xlsx)
Download Adjacency PPT Template
Whitepaper Controlling of Assumptions
Controlling of Assumptions
In each strategy definition, assumptions are made on which the development of the strategy is based. Such an assumption may be technological advances such as the digitization. Others are a certain customer behavior towards increasing service demand, economic activity or certain expectations regarding market growth.
The Tasks of assumption controlling are:
Assumption controlling implements a early warning system that detects possible deviations in order to counteract in time.
- The early recognition of external developments that deviate from the assumptions or premises
- Impact Assessment for both qualitative (eg paradigm shift in customer behavior leads to shifts in demand on distribution channels) and quantitative (impact on target revenue, cost items and market shares)
- Introduce corrective action to adapt the strategy to new circumstances
Creating an assumption controlling:
1. Working out the assumptions
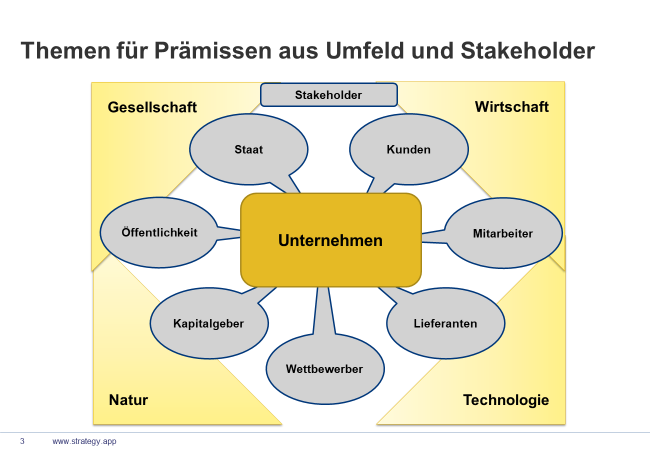
First, we compile those assumptions / premises that play a role in the future development of the company. We assign these premises as follows:
- Environment:
- Society, nature, technology and economy
- Stakeholders:
- Customers, employees, suppliers, investors, competition, public, goverment
We have put together a list of topics. It is the same list from which we also compile the main trends for the SWOT:
Economic environment:
- Global development / economic development of individual regions or national economies
- Fluctuations in international currencies and interest / inflation rates Rise / decrease of country-specific risks
- Customs duties and tariffs / International trade barriers
- Economic integration, e.g. Eurozone
Technological developments
- Development of key technologies
- Digitization / Internet of Things
- New technologies as a tool of rationalization
- Substitution Technologies / Disruptions
Ecological environment:
- Use of raw and auxiliary materials / recycling
- Sustainability / energy consumption
- Environmentally friendly operating processes
- Wastewater and exhaust air purification / heat recovery
Politics:
- Form of government / stability / legal certainty
- Foreign investment law / tax and depreciation law
- Transfer of capital / credit conditions
- Party political development / possibility of lobbyist influence
- Foreign policy development, conflicts, wars
- Increasing government intervention in the economy
Legal Development:
- Law changes / changes in regulatory competence
- Labour law / consumer protection
- Restrictions on competition
Demographic development:
- Population / population structure / age structure
- Number of households / consumers / size and structure of households (single and multi-person households)
- Level of education
- Urban / rural population
Social development:
- Leisure habits / change of values / consumption habits
- Safety conditions / risk tolerance
- Qualification level and educational development
- Social mobility
- Income distribution / structure of household expenditure
Customers:
- Market development / market share
- Target groups / market segments
- Distribution channels per product / product group / dealer and other customer intermediaries
- Customer problems and needs (incl. solutions) and demand behavior
- Changes of value norms and settings of the customer
- Customer sensitivity regarding price and condition changes
Suppliers:
- Stocks and supply of essential products
- Inventories and supply of operating and auxiliary materials
- Options for the substitution of raw materials, consumables and auxiliary materials
- General developments in the procurement market
- Development of transport prices and costs of supply chain
- Dependency on suppliers
Employees:
- Recruitment costs and challenges / salary levels and trends
- Development of legal benefits
- Union activities and demands
- Reduction and flexibility of working hours
- Education and skilled workers
Investors:
- Sources of capital raised
- Rules on raising and transferring capital
- Foreign exchange rates and interest rates
Public institutions:
- Legislator
- Government authorities
- Local authorities
- Unions
Media / NGOs:
- Public agenda and interests – e.g. human rights / climate change
- Common interests
Competitors:
- Existing competitors (by product group / market segment)
- Potential new competitors – same industry / other industry
- Market entry barriers (norms, laws, etc.)
- Degree of rationalization / use of new technologies or goods
- Innovation capacity and flexibility
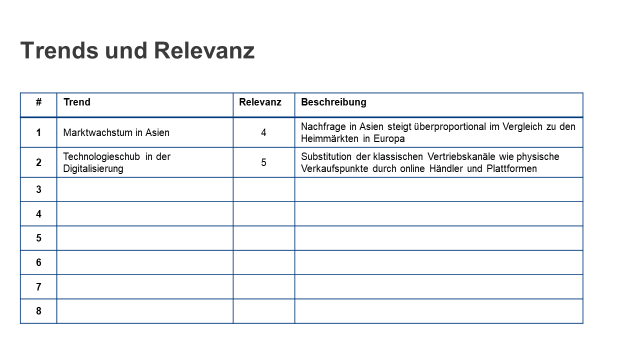
We select the trends from this list and evaluate them with relevance: How important is this trend for our company? A short description will help you later to understand exactly what is meant.
Notice::
The rule plus/minus seven also applies here. Limit yourself to one page, and if you write a little larger, it will be full with 10 trends. We want to limit ourselves to a number that is manageable and therefore controllable. The art of selection is to determine the essential trends that make up the majority of possible changes. It is a matter of selecting those influential variables which, from today’s perspective, are the significant drivers for the future development of the environments, markets, products, customers and suppliers.
2. Measurands and assumptions
Now we form the assumptions and define the measurement parameters – how to measure or assess – and provide them with assumptions for the planning period. The time horizon here is three to five years, sometimes even less, depending on the industry or assumption. An example from one of our projects looks like this:
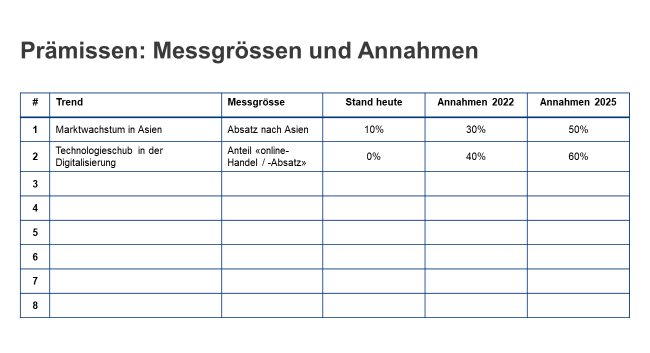
Figure 3: Determine measured variables and make assumptions
3. Precision, method and instrument for controlling
We prepare the controlling by refining the templates and describing the procedure. We will give you a few hints, which you can fill in and define as required.
Data collection
- We will collect the data – who is responsible
- What are the data sources and how should the data format be
- How often are the data collected?
Data analysis
- Describes «what happens if the expected values are not met» – does it concern the whole company or only one business area?
4. Controlling of assumptions / early warning system
The current status of all assumptions is recorded periodically and evaluated with regard to the strategy. The system also checks whether new or other external factors or events affect strategy implementation.
This raises questions such as:
- Did the economic data develop as expected?
- Has the technological development for substitution gone so far that the new basic technologies can be used?
- Are the conditions for market entry in China still good?
- Are customer behavior and demand for the new service developing according to the assumptions made in the strategy process?
- How far is the main competitor with innovative product development? Are we still one step ahead?
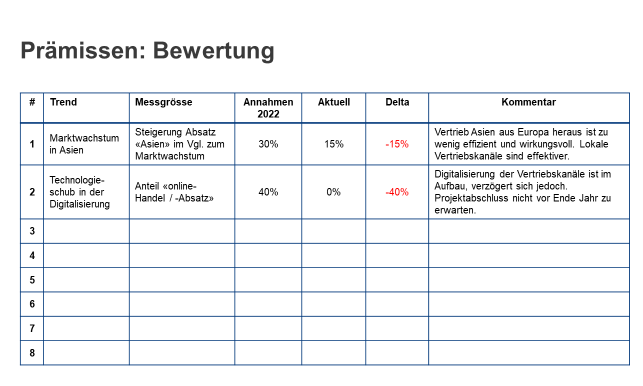
From assumption controlling to early warning system
It may well be that certain assumptions have been out of date since the last adoption of the strategy, or that new conditions have emerged that are relevant to the strategy’s implementation.
The 360° radar serves to keep a comprehensive eye on developments around the company, but also within it. The process responsibility for this task lies with the corporate development or the department that we call strategic planning. To ensure that all relevant facts are recorded and taken into account, however, the entire company must be involved. This can be done, for example, by systematically requesting or delivering market-related information from the sales department. A monthly feedback round serves as an instrument to keep the flow of information from the market going. For example, a company holds an open telephone conference every Monday. Sales staff can share their news for one hour. The procedure is organized in such a way that everyone joins in when and as soon as they can. There is no agenda and no discussion. Information is passed on as in an informal coffee break. After some time, this has meant that employees are eager not to miss this «meeting» because it is here that the most important news is exchanged.
Strategically relevant information is systematically collected and tracked in order to make any necessary adjustments or initiate measures.
Systematic market, competitor and customer research is part of this process. In addition, technological topics and news from the field of innovation management can be included.
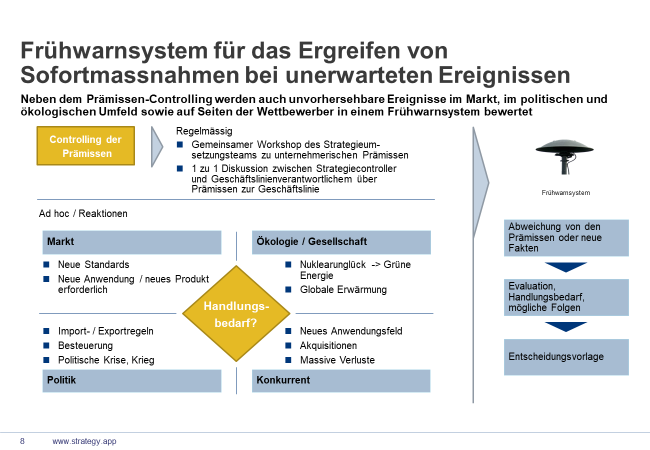
The capture, filtering and exploitation of the information is then the responsibility of the strategy planning department. For events that require immediate response, the early warning system is turned on (see below); further facts are recorded and incorporated into the strategic review meeting.
5. Development of corrective measures
If deviations relevant to the strategy have been identified, the effects on the strategy must be assessed and the need for action evaluated. The same applies to new influencing factors which have been identified and analyzed in these assessment and evaluation steps.
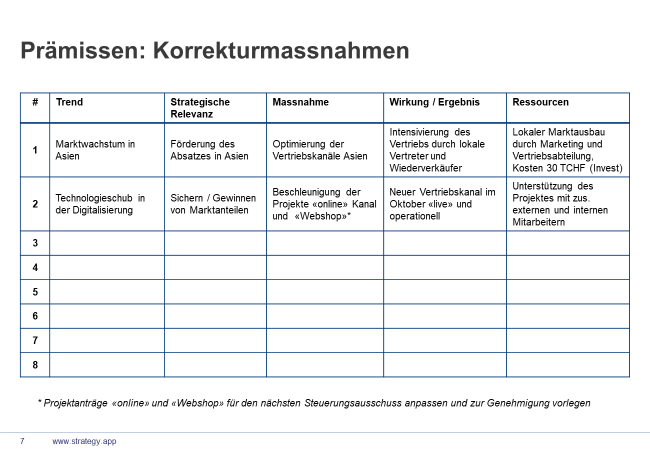
The deviation is documented for each premise and the new influencing factors requiring action are evaluated and proposals for corrective measures are developed.
This work is carried out periodically, e.g. every three months or once a year. This ensures that strategy implementation is always based on relevant assumptions and that new influencing variables are identified in good time.
Basic remark
The growing complexity and uncertainty of market and industry developments presents strategic controlling with new challenges. Focusing on a detailed situation analysis and high-level preview methods is only one part of the work. So-called future scenarios are not used to illustrate what will be, but, what could be. The aim is not to predict a future as accurately as possible, but to form the scenarios that are decisive for the implementation of the strategy with the targeted recognition of external drivers and influencing variables. Using new scenario techniques, excellent early warning systems can be developed and introduced in a targeted manner. In addition, managers and employees are sensitized to important trends and external influences and thus to perform an additional «sensory» function for environmental changes.
We have prepared a Power-Point template for you to download here:
[popup_anything id=»1113″]Whitepaper Marketplace
Out of the box or outside the box
We use the marketplace at the very beginning of the design phase for the development of strategic options – in a mostly full-day workshop involving the entire team, which is best complemented by additional employees from the company.
To start with, ideas are collected on cards, usually only by keywords (the classic card sticking that you all know). At the end, we have concrete options that are not only written on a flipchart but have been approved by several participants. Discussions help to capture the ideas in the minds of employees and thus become a common good.
The procedure is fun, gives the participants a lot of freedom and brings the best ideas of the organization first onto paper and then into the minds of the participants.
Ingredients
For the marketplace to live properly, at least 12 people should attend. But it can also be up to 30.
-
Room: To do this, we take a room large enough for people to move around, group together and discuss. As a rule of thumb: Number of participants times two in m2.
The one wall is kept free to place cards – either directly on the wall or on bulletin boards. Each participant will write about 5 – 10 cards. All other walls are kept free for described flipchart sheets. - Pinboards and Flipcharts: Then we’ll provide flipcharts, about one per three participants. If the group consists of 20 people, we provide 6 or 7 flipcharts. On each flipchart are about 15 – 20 sheets prepared so that they can be filled directly.
- As preparation, we will create a description of the current activities on a morphological box . Alternatively, the eBMC can also be used (extended Business Model Canvas). This description is hung up or distributed as a big expression.
- What else do we need: Cards – about 10 per participant. The color may or may not be used consciously. Pens for each participant complete the ingredients.
Procedure
As an introduction, we again specify the characteristics of our company. A suggestion for the dimensions are:
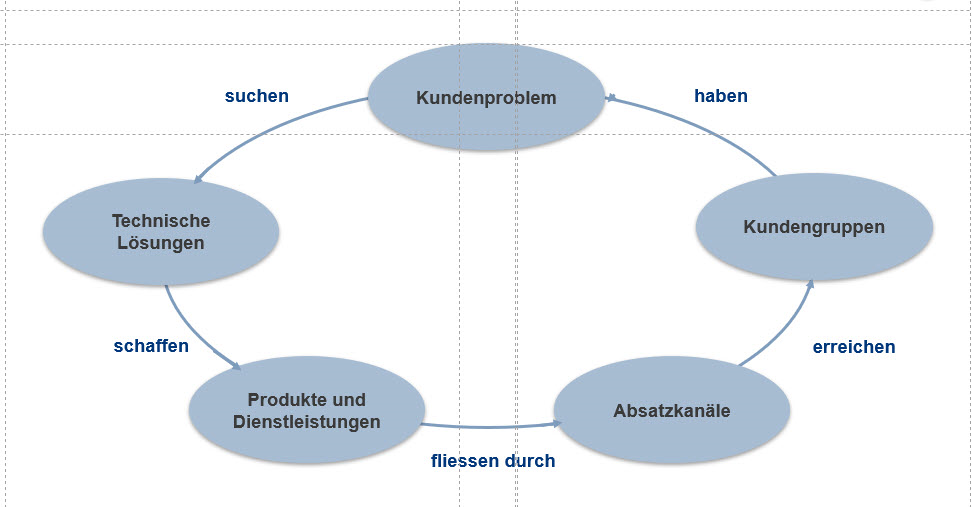
- Marktes
- Products
- Technologies
- Customer needs
- Customers and customer groups
- Sales Channels
Optionally, we list the existing characteristics and already have their first ideas:
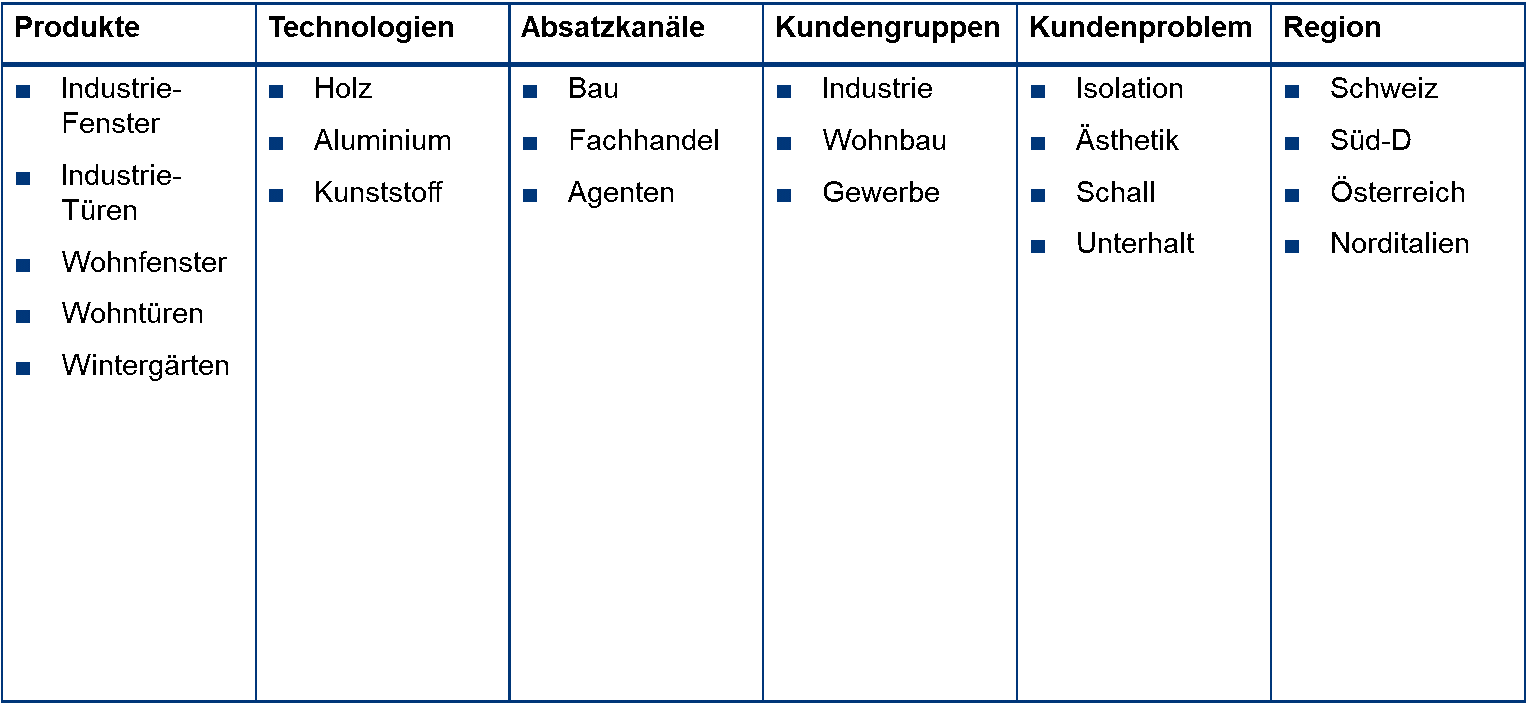
Then we systematically search for new ideas in every dimension. You can assign the participants to the dimensions. So that one group is looking for new technologies, the next for new markets and the third for new sales channels.
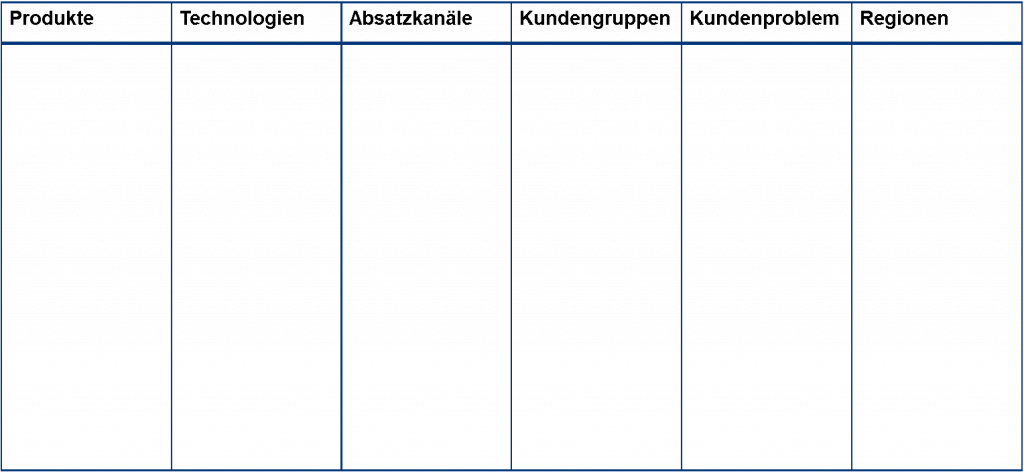
To do this, we’ll go through the following steps:
Step 1
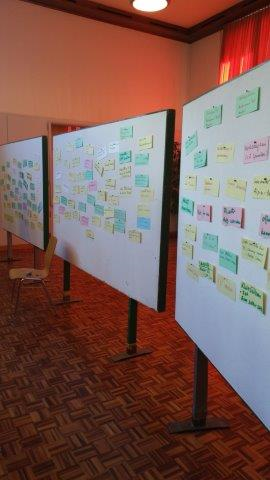
Ideas and options are written by the participants on cards and attached to bulletin boards or directly to a large wall. The cards are mixed and presented in disorder:
Step 2:
The participants briefly present their ideas and explain the background of each card.
Step 3:

To make enouch spade in the room – all the tables are pushed against the wall, and the marketplace is set up. For each 3 – 4 team members a flipchart is set up. For a team of 15 members, 3 – 5 flipcharts are placed in the room. On each flipchart are about 15 – 20 sheets prepared so that they can be filled directly. These flipcharts are now the stalls on the marketplace where ideas are sold, as follows:
Step 4:
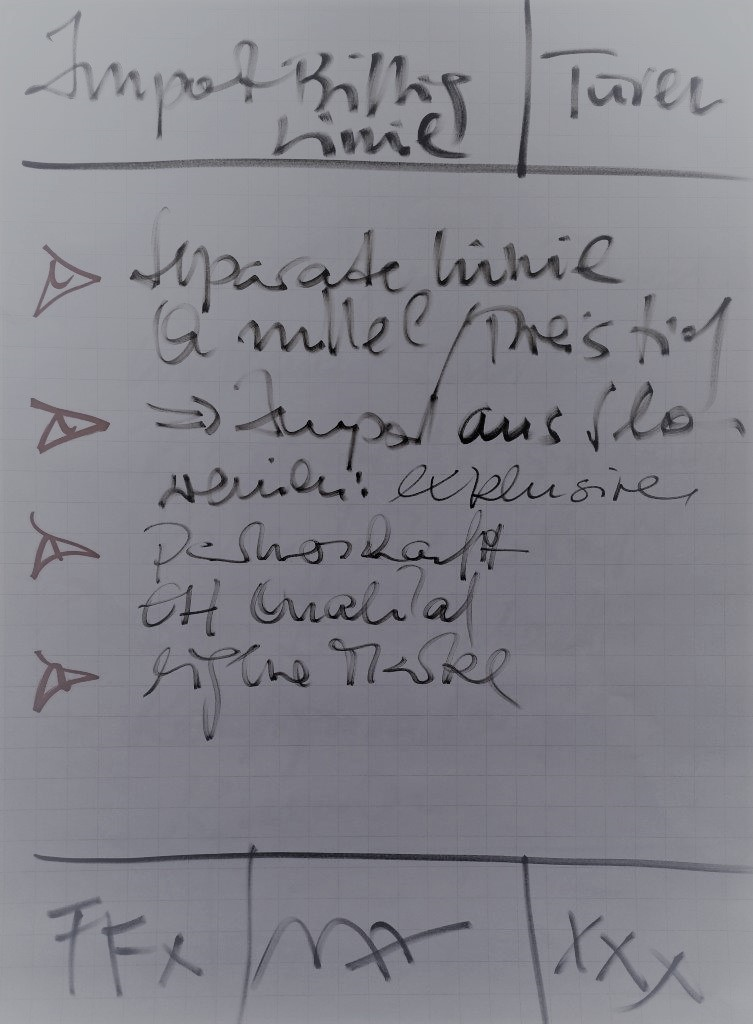
Each member of the team has the task to concretize his ideas on a flipchart, to discuss with colleagues and to explain them. This can be ideas that it has captured on the cards, but also new ones that have emerged from the presentation of others. The brainstorming cards are not taken away but remain in their place. The reason is that the same cards can continue to be input for new ideas. Now the author sells his idea to his colleagues and tries to convince them. These testify with their signature, i.e. the currency in this marketplace are the signatures – and of course the ideas are sold. Ideas or proposals that do not convince at least three colleagues are eliminated.
Step 5:
As soon as an idea or option has received the signatures of at least 3 people, any further discussion will be stopped. This is the task of the moderator. He removes the flipchart and attaches it in turn to the designated space on the wall of the room. We recommend to number them immediately.
Step 6:
The options listed on the flipcharts are presented by the «owners» and explained again.
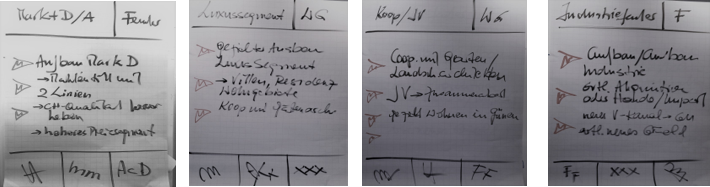
Step 7:
The options thus compiled and discussed are now bundled, i.e. if there are overlaps or duplicates, then we put these together.
The next step is to capture, describe, and evaluate these options:
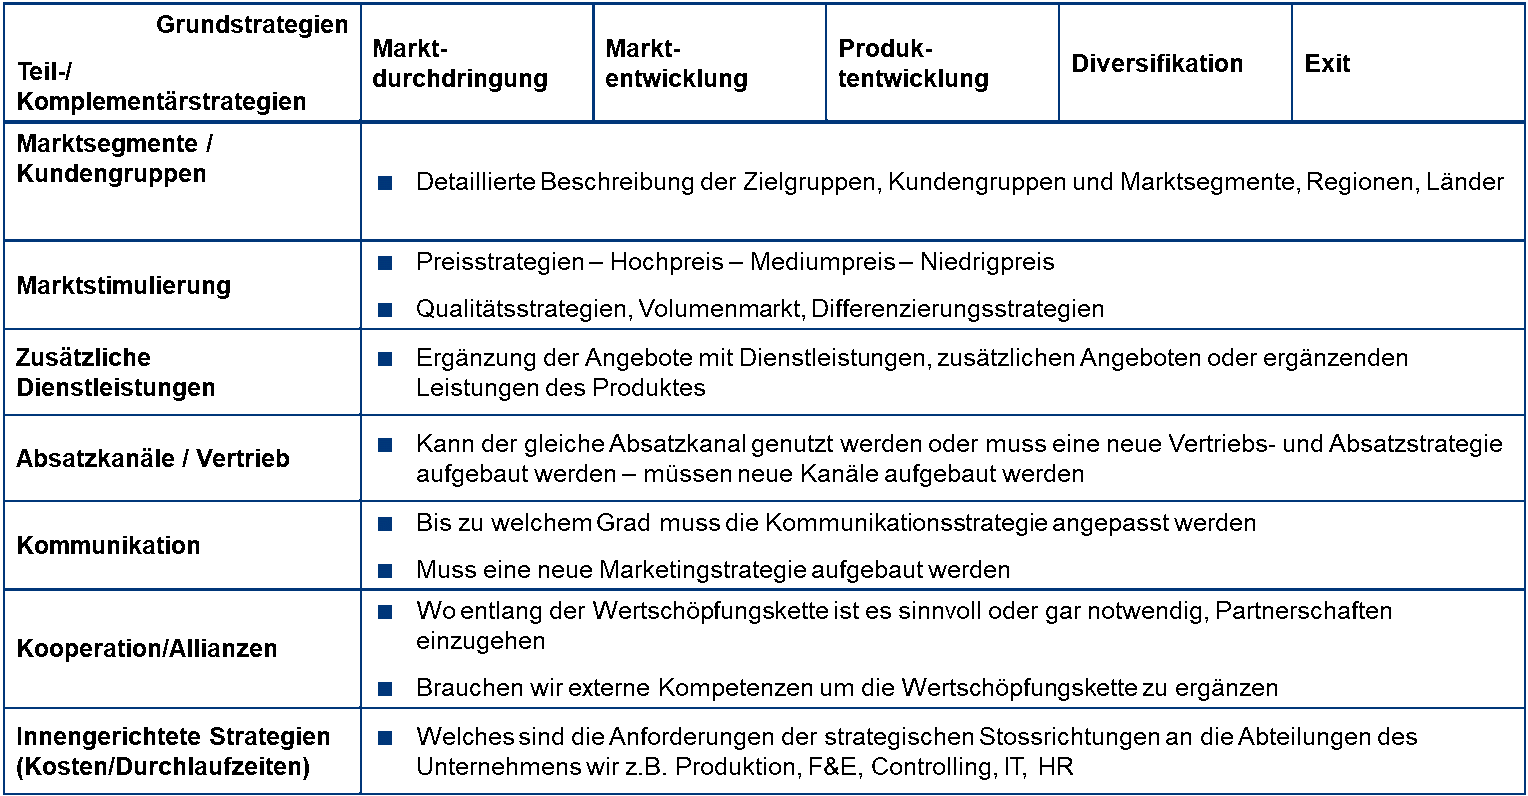
For the evaluation of these ideas or options, we use the instrument Adjacencies.
With STRATEY.APP these options are now captured and then further elaborated.
Collect and evaluate the strategic options in STRATEGY.APP
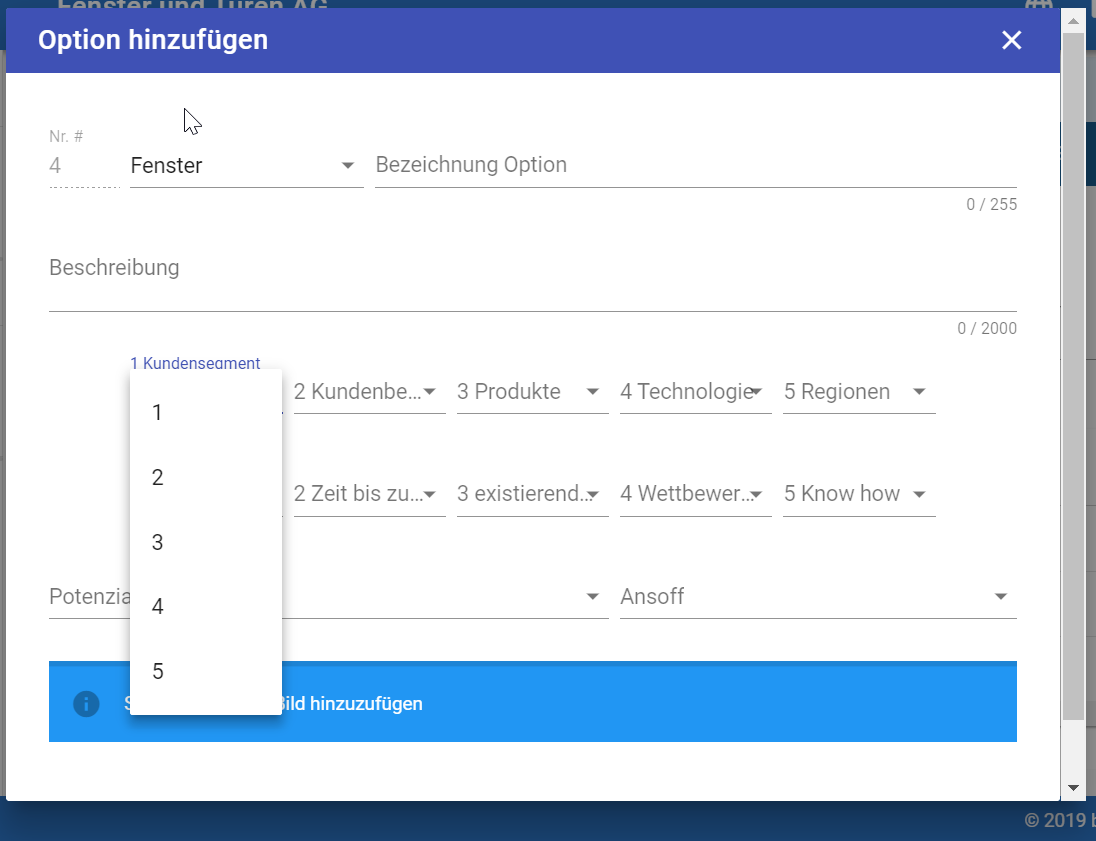
We record all options in the program and evaluate them according to the two dimensions
- Distance to the core business and
- Distance to success
As a result we get a list of options that are assigned to the respective business units.
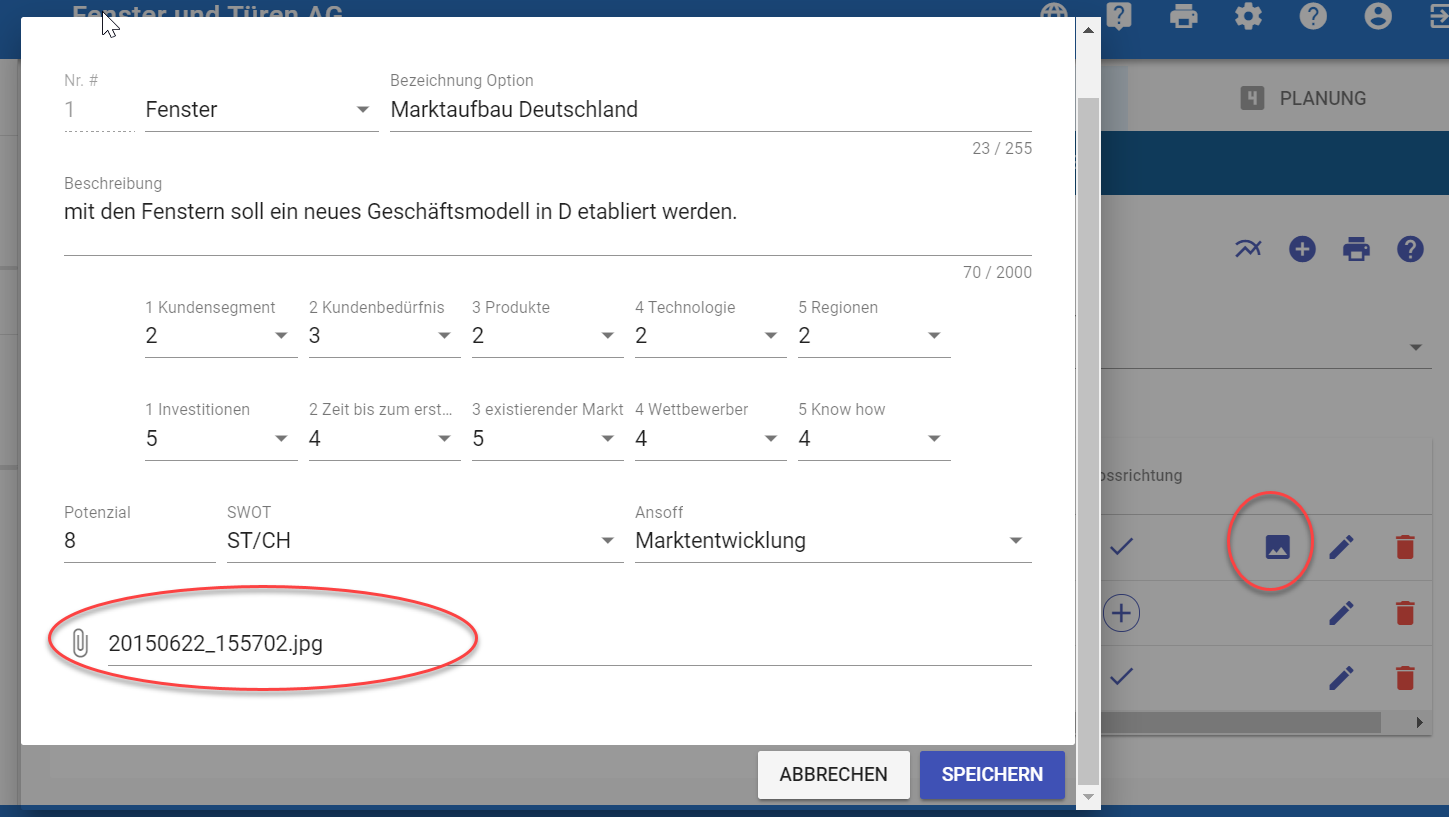
In addition, we have the opportunity to load the flip charts into the program. With that we can see the origin at any time.
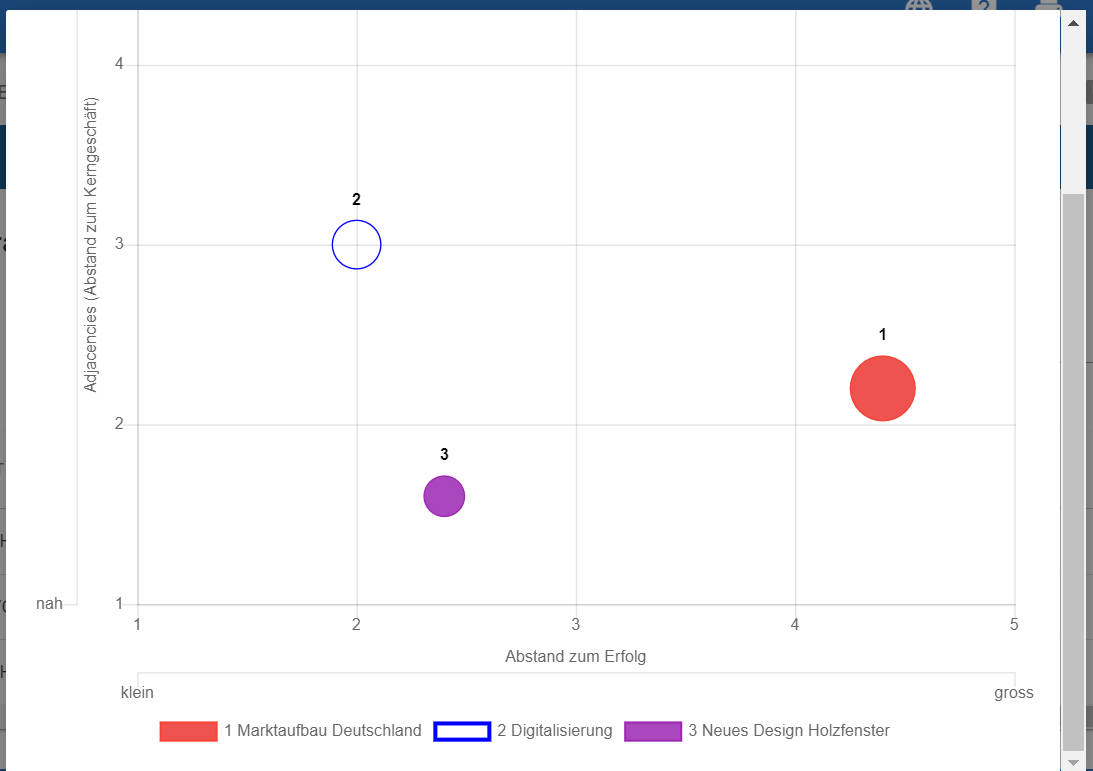
The Adjacency chart now tells us where each option comes from. From this we can select the strategic directions and then initiate the next steps.
See our whitepaper adjacencies
White Paper Innovation Management with the «Extended Business Model Canvas» (eBMC)
From the BMC to the eBMC
If you compare the Business Model Canvas with the navigation system of Aloys Gälweiler, you will see that the innovation is positioned there on the top level, with the two components «solution-independent customer problem» and «solution technology». We then put these two building blocks on the Business Model Canvas, making this extended Business Model Canvas (eBMC) a great tool for innovation management.
The book «Business Model Generation», published by Alexander Osterwalder, has hit the world of consulting and entrepreneurs like a bomb. The book is practical, very nicely done and above all very different from anything else in the field. And success proves the author right.
When a colleague told me about this model for the first time, something irritated me from the beginning – something was missing. It’s not like the BMC reinvented the world. Much can be found in it from known approaches and methods – or not.
What was lacking for me from the beginning is the building block «customer problem», namely the «solution-independent customer problem», as we used to call it. Based on the St. Gallen approach, we have always clearly separated the customer problem from the product or service itself.
The «Solution-Independent Customer Problem»
A watch is a product for the purpose of indicating the time. The customer problem, namely the time to know, however, is independent of the clock and can be solved differently. This applies even more clearly when the watch is offered as a luxury or status object. Then the customer problem is to make a difference, and that can be solved with completely different offerings or value propositions.
In the BMC, the customer problem is presented together with the building block product and then called «value offer» in New German. Later, a separate canvas was developed for the building block customer problem and with the help of the so-called empathy card (by Xplane).
I did not let this thought go, and I studied how the canvas model can be complemented with the customer problem without destroying the model’s logical unity and symmetry. And as is sometimes the case, the best thoughts come when you are alone: During a long run through the forest, I had the following idea: Let’s take the top level of the navigation system of Aloys Gaelweiler with the two components «solution-independent customer problem» and «solution technology,» and put them on the business model canvas. This makes this enhanced Business Model Canvas (eBMC) a great tool for innovation management.
This results in the following chain: customer – customer problem – technology – product or if you prefer: product – technology – customer problem – customer. The interesting thing is that the model remains nicely symmetrical and fits together logically.
Innovation Management with the eBMC
Supplemented with the two building blocks from Gälweiler’s navigation system, we use the canvas model mainly in the search for new businesses. This makes it an excellent instrument for innovation management. Because innovation can be driven forward from two sides: the market and the technology. Good practical instructions have been provided by Prof. Hugo Tschirky, who teaches at ETH Zurich, with his approach to innovation management. We find it in the book « Wunderwaffe Innovation «by Beat Birkenmeier and Harald Brodbeck. In the following, we will explain the two components «customer problem» and «solution technologies» in more detail so that you, too, can supplement the Business Model Canvas accordingly and use it as an innovation tool
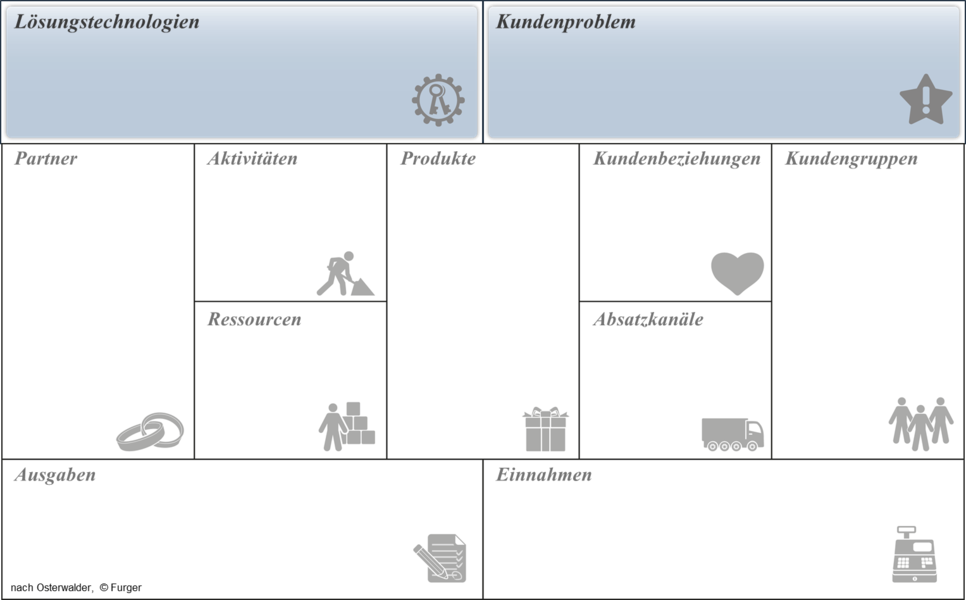
The module «customer problem»
This component stands for the customer problem that a company wants to solve – and that is about the «solution-independent customer problem». This means that this customer problem is often latent and is only solved differently and better by new products or services.
Here is an interim remark: We use the terms «customer problem» – «customer need» and «customer request» as synonyms. You are free to use your appropriate term here.
Solving a customer problem brings benefits to the customer, and it is for this benefit that the customer is ready to pay. So the product «car» is not primarily a beautifully designed machine on four wheels, but creates the ability to move from A to B at any time. It is often useful to abstract a business idea to this «problem» in order to come up with new solution techniques. Innovation, which is based on the market, is mainly concerned with it and can only work if you know the original customer problem exactly.
These may be a original problem as such like eating and drinking or secondary, derived problems such as luxury goods, holidays or other amenities that go beyond a basic elementary need.
The most important questions about this module:
- Which customer problem do we want to solve or which customer needs do we want to satisfy?
- What does the customer really pay for?
- What is the background of a problem solution?
- What are the real purchase criteria from the customer’s point of view?
- Which purchase criteria are better covered by our products?
- What brings the customer to put the money on our counter instead of the competition?
Instrument Customer Value Analysis (Value Proposition)
The customer value analysis is probably the didactically best instrument to focus the company in its activities on the customer benefit. The instrument can be set up directly on the building block customer problem. This creates the logical and substantial connection between customer benefit – products – customer groups.
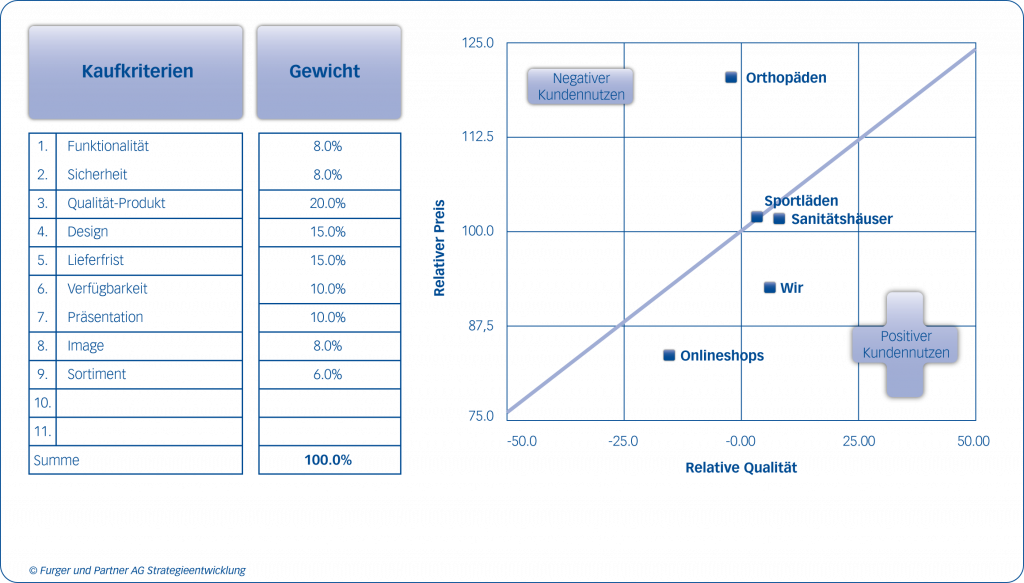
On the basis of purchase criteria, a strategic Value Map is created that shows which competitors bring benefits to the customer with their products. For a detailed description, the tool itself, and the tutorial, see the white paper Customer Benefits on our BLOG
The module «Solution Technologies»
This component represents the technical solutions behind a product or service. Technologies usually have a specific lifecycle and, after a certain period of time, are replaced by new technologies that solve a customer problem better and more favorably. Thus, a substitution process begins, which leads to the replacement of existing products in the market. This process normally follows the pattern of an S-curve.
An example of this is the substitution of horse-drawn carriages by automobiles. Innovation always takes place in the interplay between the knowledge of the original customer problem and new solution technologies. The timeframe of substitution varies and can go on for years. The first presentation of a new solution concept is called invention, while innovation only exists when the product prevails in the market. Solution technologies can be incremental improvements or implement completely new concepts like the laser printer or the fax technology that has substituted the telex. Such completely new approaches often turn the existing business model upside down, which is described by the term «disruption».
The most important questions about this module:
- Which existing solution technologies are behind the products?
- In which phase of life are these technologies?
- Where are new inventions, and which customer problems can be resolved (much) better?
- Where and in which technologies does our company have competencies – a lead over the competition and therefore core competences?
- For which purchase criteria can we make significant improvements?
Instrument substitution analysis (S-Curve)
With the substitution analysis, the replacement of existing products or technologies by new offers can be shown.
This instrument helps on three levels:
- to find the optimal time to enter a new market (or exit)
- To set the growth rates in growing markets against the market and the competitor.
- To plan the transition to a price or cost market, and thus to exploit the cost position or to withdraw from the market.
eBMC in the STRATEGY.APP
For each business area, we create the eBMC with the current key elements. Each module is filled accordingly and can be adapted, printed or otherwise communicated at any time:
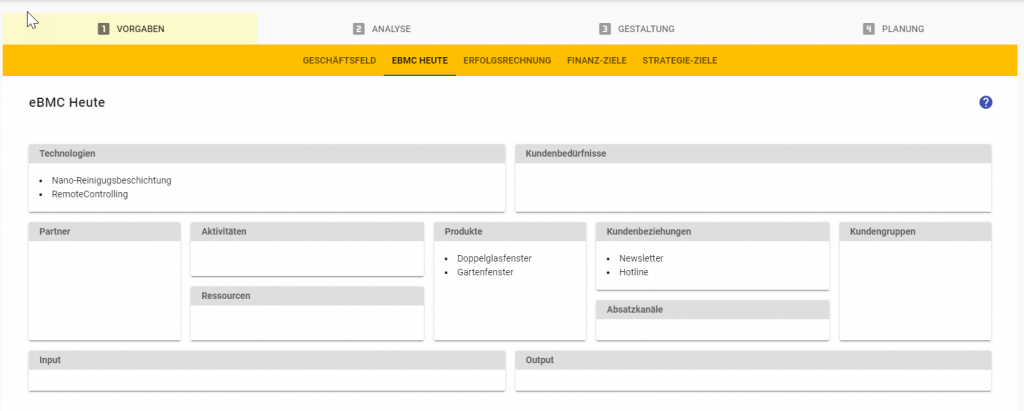
The individual blocks and elements are entered in the usual editing window:

In the design phase, we can now add additional key elements; here e.g. as a new technology, the «nanotechnology» applied to the coating of the glass; or a new sales channel with which customers will be served in the future:
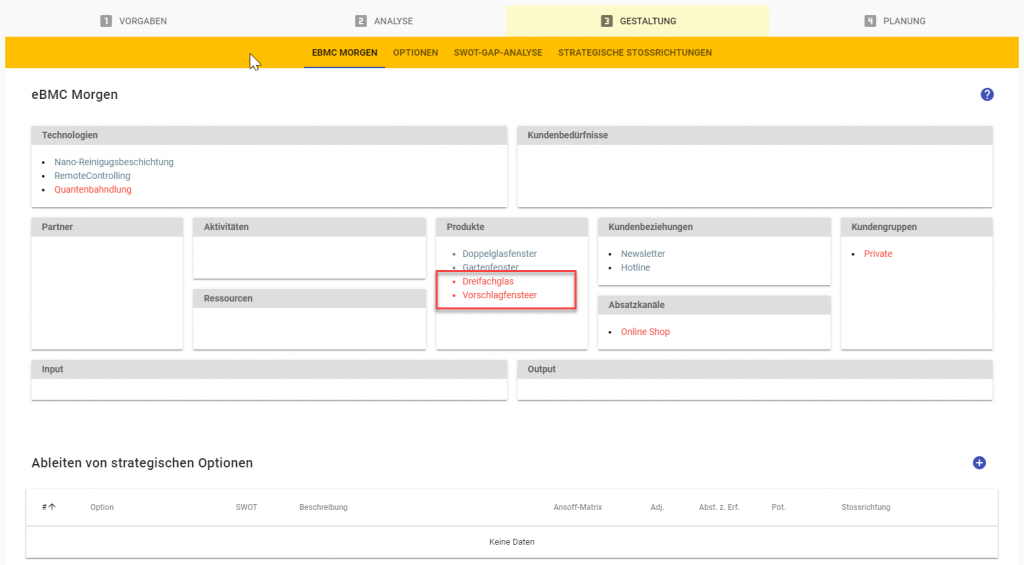
The new elements appear in red for identification. This provides us with a basis for deriving new strategic options and developing strategic directions and measures.
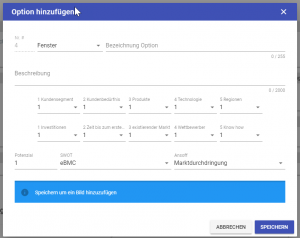
These are then listed in parallel with the options derived from the SWOT.
Here, too, options can be added, added, stopped or deleted at any time.
White Paper Competition Analysis
Download the Competitive Analysis (pptx) tool
Competitive analysis shows our relative advantages over the competition. We compare the strengths of the competitor with our weaknesses and their weaknesses with our strengths. Every employee must be able to recite these benefits by heart at any time!
In the process described here, we first summarize the essential characteristics of a competitor into a profile. Then we create a profile of the strengths and weaknesses that every salesperson and every employee who deals with customers has to memorize.
Additional knowledge of competitors will provide additional tools such as the value proposition.
Note : I like to use the term competition – because competition comes from the Latin «concurrere» – to run together; and that’s about it.
Procedure
1. List of current and future main competitors
List all competitors that are strategically relevant to your business. We distinguish four groups:
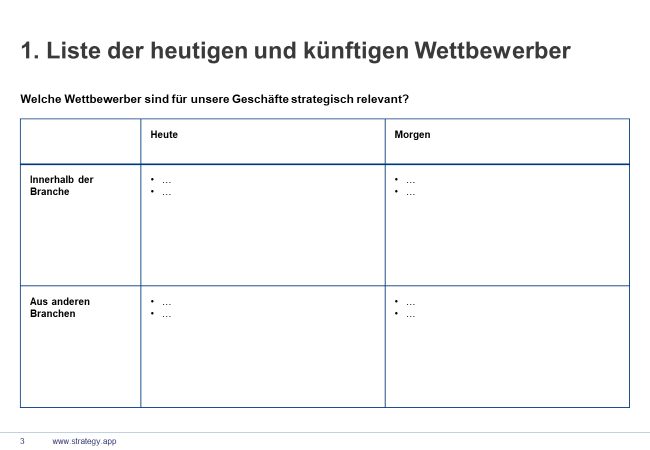
- Competitors today within the same industry
- Competitors tomorrow within the same industry – e.g. from other regions
- Competitor today from other industries
- Competitor tomorrow from other industries
The competitors from other industries are the most dangerous. For example, the «Enzyclopedia Britannica» by PC with the Encarta displaced – and that was very fast and none of the former typewriter manufacturer has considered the entry of PCs. The most dangerous competitors today for the automotive industry are not the other manufacturers, but new providers we Google, Apple or Uber.
2. Overview
For each competitor, create an overview on a sheet by template (this is to be memorized):
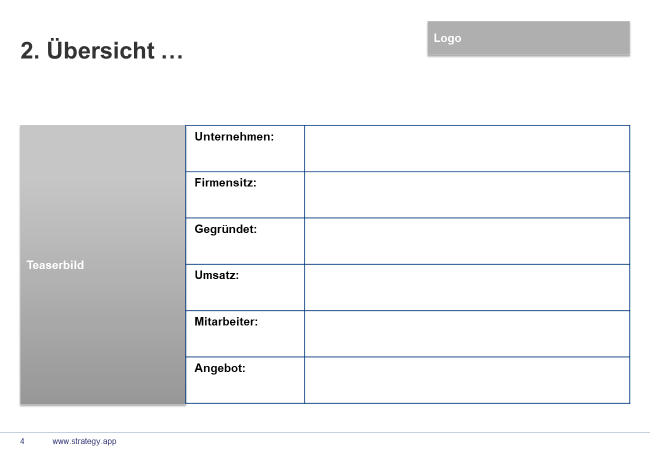
3. Key data
The key data is used to record the essential characteristics of the competitor. Do not write novels, but not just embroidery, but try to make one or two clear statements. Above all: do not just copy the details from the website of the competitor! First, these are mostly inaccurate and not very specific, and secondly, any learning effect is lost – and that’s a pity about your time.
We’ve listed a list of topics below so you can customize the template as needed.
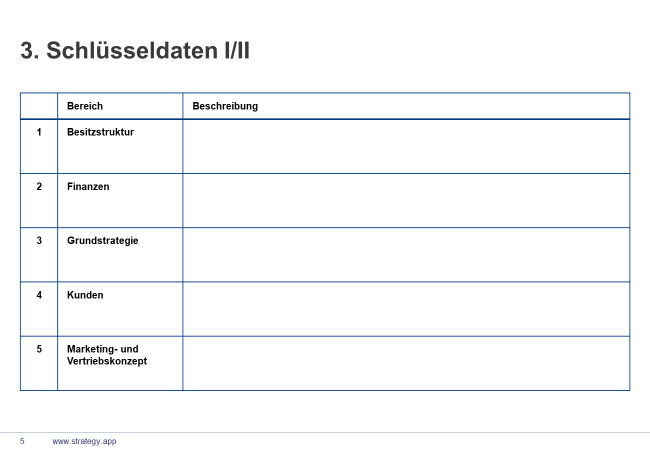
4. Strategic Comparison
The strategic comparison presents the 3 main strengths and main weaknesses of the competitor against the 3 main weaknesses and main strengths of your company. Enter a maximum of 3 topics here and formulate them in such a way that they can be memorized by your employees. Ask them in between or distribute them on colored cards, which have space in the wallet.
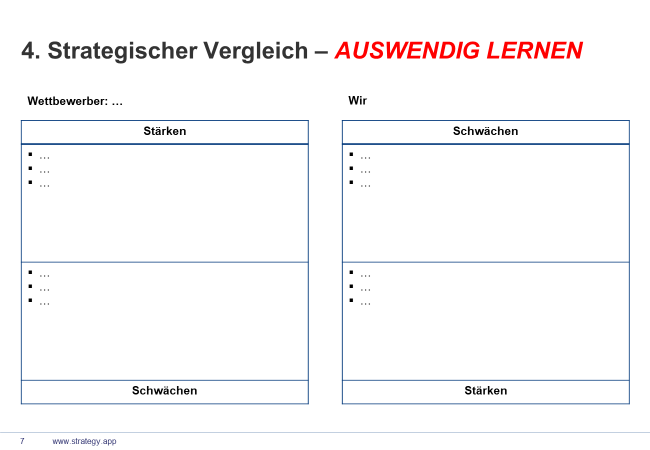
5. The analysis topics
We have listed some topics for you in the template. You can supplement, adapt or replace these. The following list should give you some ideas or hints:
Ownership Structure
- Ownership structure of the company
- Capital structure, total market value and ownership
- Participations, major shareholders and other shareholder participations
- Legal form
Financials
- Sales, earnings in ROI, ROS and EBIT
- Order situation and order backlog
- Liquidity
Strategic key figures
- Market position and market share
- Cost position, efficiency, experience curve
- Quality position and customer value
Basic strategy
- Current situation and starting position
- Growth strategies, acquisition strategies, cooperation
- Regional strategies and regional presence
- Strategic alliances, acquisitions, JV, cooperations
Customers
- Main customers, main markets
- Sales by segments or by region
- References from major customers
Sales and marketing concept
- Sales organization
- Sales and distribution channels
- Marketing activities
- Brand strategy
Product and service portfolio
- Product lines, product range, brands
- Standards, certifications
- Service, repair, spare parts
Core competencies
- Core competence areas today and tomorrow
- Special products, services
- Processes (supply chain, sourcing concepts)
Production and production concept
- Organization of locations, processes
- Integration strategy – vertically / horizontally
- Strategy of the logistics organization, delivery times
- Local production (production location, products)
- Production capacity
Technologies and Innovation
- Ability to innovate
- Expenditure on research and development, patents
- New technologies
- New products in operation
- New technologies in production
Competitive Analysis in STRATEGY.APP
In the setup we enter all competitors that occur during the strategy development. The basic data usually relate to the same level as our own company; i.e. you describe an entire company or the division of a group.
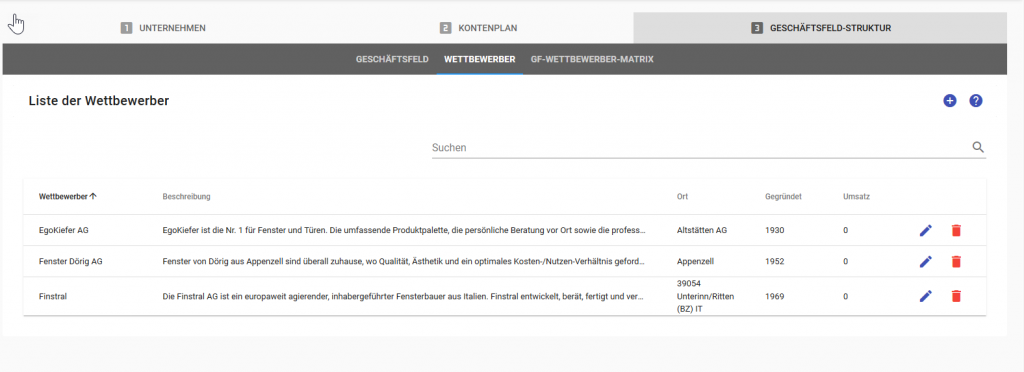
Then we assign the competitors from the overall list to the individual BU. The question is, where does a competitor in the market compete with us? With a simple click, a record is created for the corresponding BU. Only the name of the competitor is taken over. All other and further data are dealt with in the BU-strategy. If a competitor assignment is deleted, the record from the BU-strategy is deleted again.
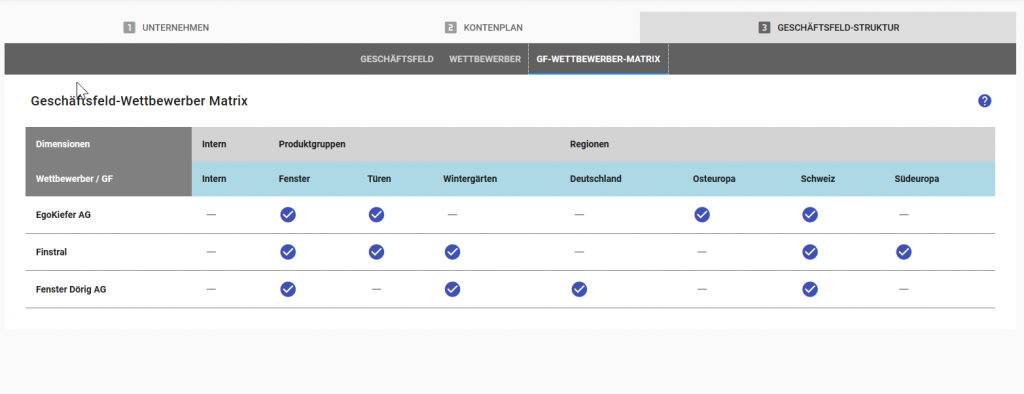
We can now analyze the competitors at the corporate level and / or at the business field level and derive SWOT elements for the SWOT. Here we show the procedure at the company level.
All competitors we’ve covered are listed at the company level. The description fields are taken from the configuration.
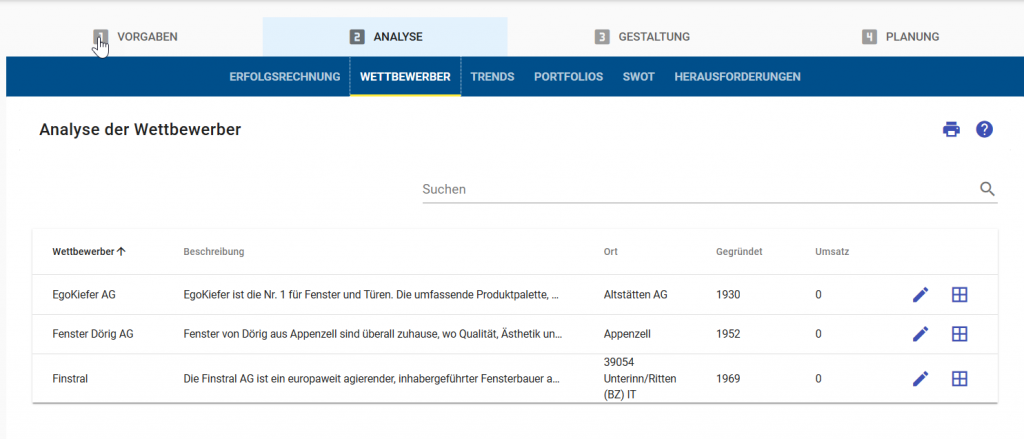
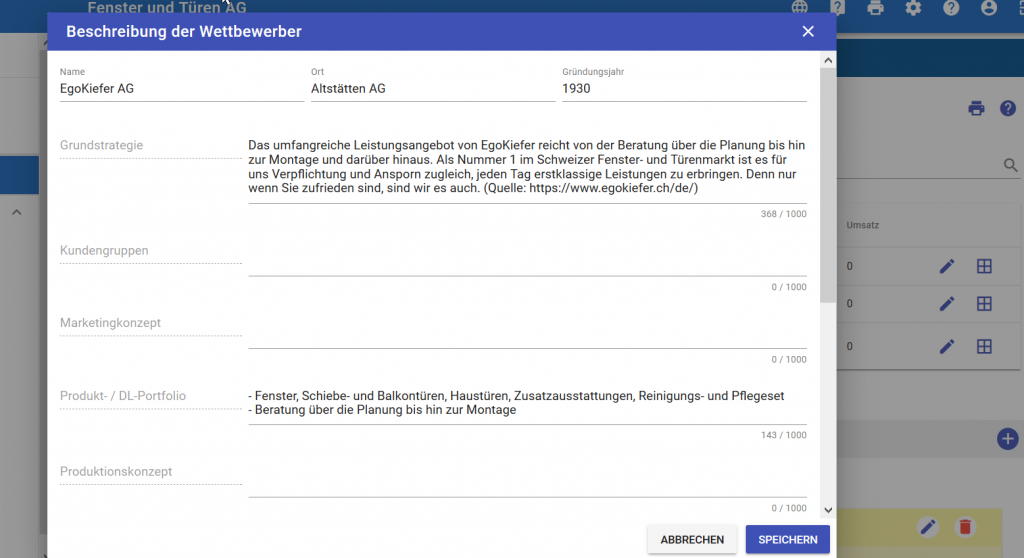
There are two dialog windows available:
- Edit: Enter and customize competitor data descriptions
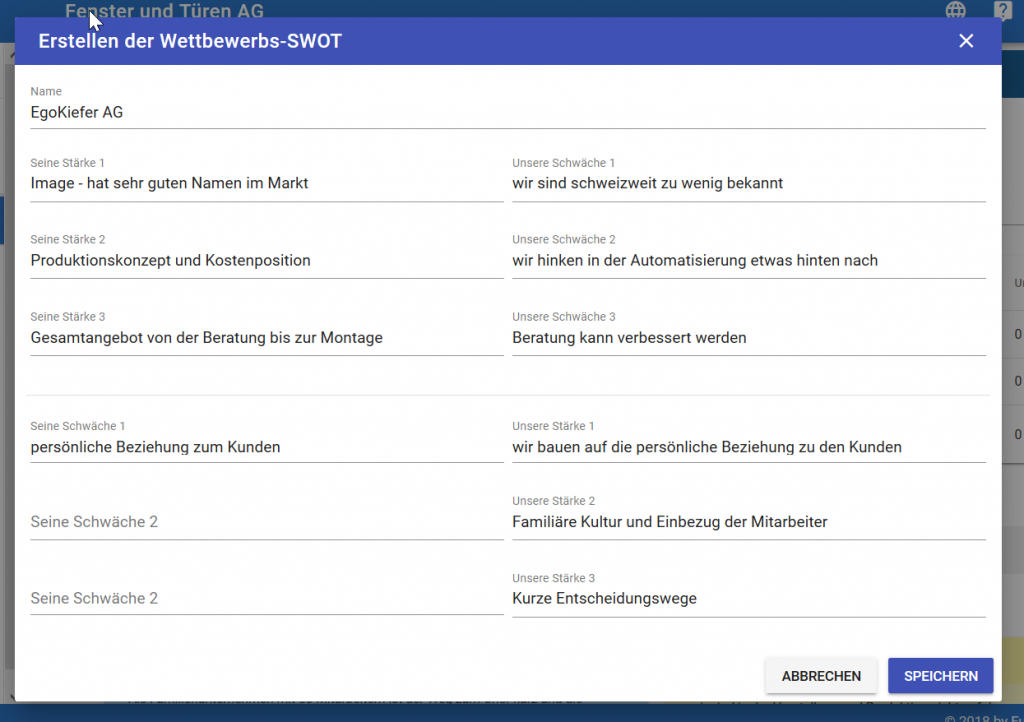
- SWOT: Enter each of the competitor’s three strengths and weaknesses and the corresponding weaknesses and strengths of your company that they face.
For each competitor, the 3 strengths are contrasted with our weaknesses and the 3 weaknesses are our strengths
The same procedure can also be used for every business field.
Download the Competitive Analysis (pptx) tool
Whitepaper The eBMC as an Implementation Tool for the Innovation Architecture
The innovation turbo
We started a trial once and filled the results from the innovation architecture into the eBMC. And lo and behold, now we had a stable basis on which to derive innovations, directions and measures; almost like in a real strategy.
That works as follows:
The innovation architecture as a basis for the delimitation of strategic focus areas
The «innovation architecture» serves to increase innovation success while taking social trends and the use of new technologies into account, by enabling simultaneous consideration or coordination of market, product and technology aspects.
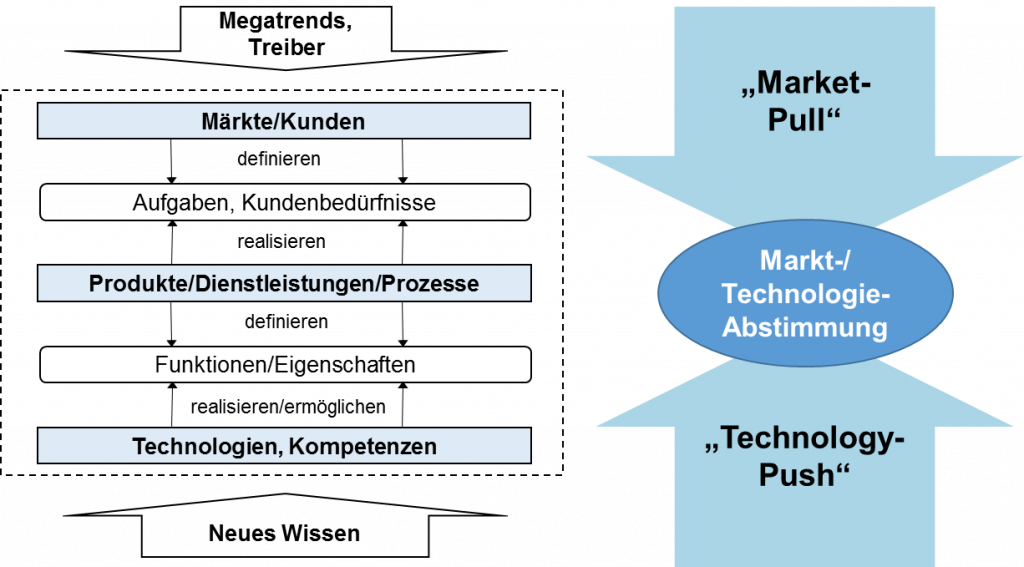
The various levels of architectural observation are logically linked from both the market and the technology point of view and are mutually dependent: On the one hand, trends affect the markets and the behavior of current and potential customers. In concrete terms, the influence of trends is expressed in specific customer tasks and needs. Satisfying these is the primary objective of shaping the market offering, i.e. products, services or business models. In order to provide this service, you need to click on of the other side requires competences or technologies. They fulfil – abstractly formulated – those functions which are necessary for the satisfaction of the customer needs are necessary.
For a Approach «from the market «, in marketing also known as «Market Pull«, we therefore try to optimize our own market offer as much as possible. to meet the needs of the markets. An essential feature of this The point of view is that the customers you want to serve are at least are known to the public to some extent. When looking at «from the technology or Competence her«, also known as «Technology Push«, this is not the case. must be the case. Rather, the question is in the foreground here which Needs in new markets on the basis of available competencies could be satisfied.
If one now fills the individual levels of the «innovation architecture» with concrete content, one obtains a suitable basis for deriving so-called «strategic focus fields» for innovation. In a somewhat abstract formulation, these are search fields for raising innovation potentials, which serve as a source for new market services or offers over a longer period of time. Within these fields, active search is now made for innovation opportunities and solutions are sought . Or something more concrete: Fields within which a company wants to innovate.
The limitation of a strategic focus field is not absolute, but it gives every company a framework to increase the chances for successful innovations and to minimize the risks.
What do we do with the result?
The identification of strategic focus areas forms the basis to fill the eBMC:
- We can create one eBMC per focus field or combine several of them. The prerequisite is that at least one business idea can be created from this.
- Then we put together the customer criteria on the one hand. For this we use common KN tools, such as the Kundennutzenanalyse or the Value Proposition Canvas (VPC). The evaluation of customer problems – customer needs – customer benefit criteria helps to precisely define and define the offer from the market point of view.
- On the other hand, we capture all the key technologies necessary for this.
- The description of the product or offer is a derivation from customer benefits and technologies. It is the solution for which the customer is willing to pay. This solution now has not only any derivation, but is strategically embedded, or in English: we have a «STRATEGIC FIT».
- Now we have to fill in the remaining fields of the eBMC, either with already existing elements or with new ones that have to be created. We recommend that new elements be highlighted in color. Immediate measures can then be derived directly from this.
- Now we embed the result into the corporate strategy and define the options, directions and measures, and the recipe is ready.
The procedure step by step
Step 1: Creating the innovation architecture
When creating the innovation architecture, the aim is to fill the above-mentioned levels with concrete content that is relevant for your own company. The following procedure has proven itself:
- Initial filling of the individual levels: This is done by collecting existing analyzes from the market and technology perspectives and comparing them with the corporate strategy.
- Complementary strategic innovation analyses to close remaining gaps in the innovation architecture: This can be achieved through partially standardized interviews with management and key persons from the areas of market, technology and product. On the other hand, targeted analyses are carried out along structured work instructions. These serve, for example, to determine the company’s own core competencies, future customer requirements, relevant megatrends and their consequences, as well as new Technologies with relevance for the company.
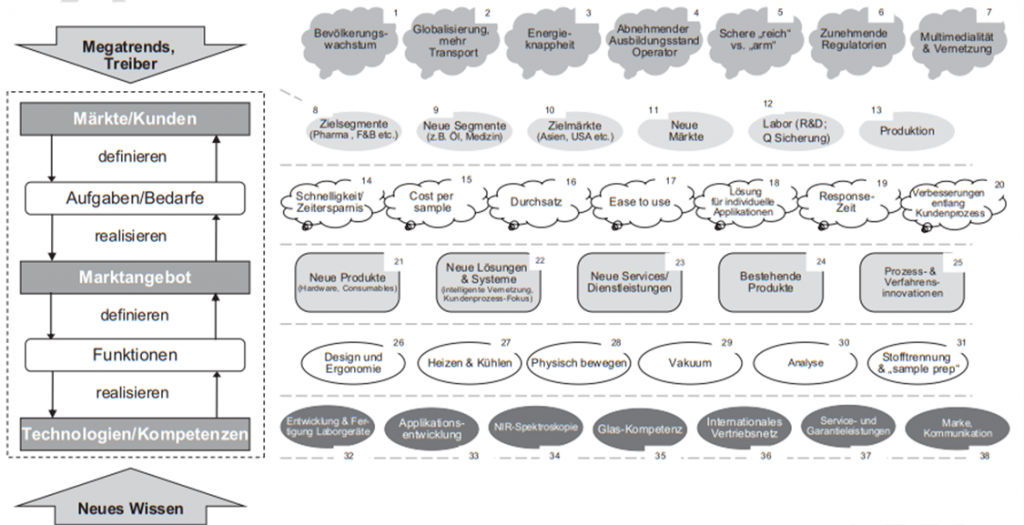
- Setting up the innovation architecture: The results obtained are continuously assigned to the individual levels of the innovation architecture until the picture is complete from the point of view of the core team. The art is to find a granularity suitable for further processing – not too generic, but also not too detailed. Results consisting of 40 to a maximum of 70 elements have proven themselves in practice.
Before further work is started, the innovation architecture should be adopted by the management as a suitable basis for the next steps. This includes a check of the completeness and quality of the content as well as of the granularity. The following figure shows an approved innovation architecture of a manufacturer of chemical laboratory equipment:
Step 2: Identification of strategic focus areas
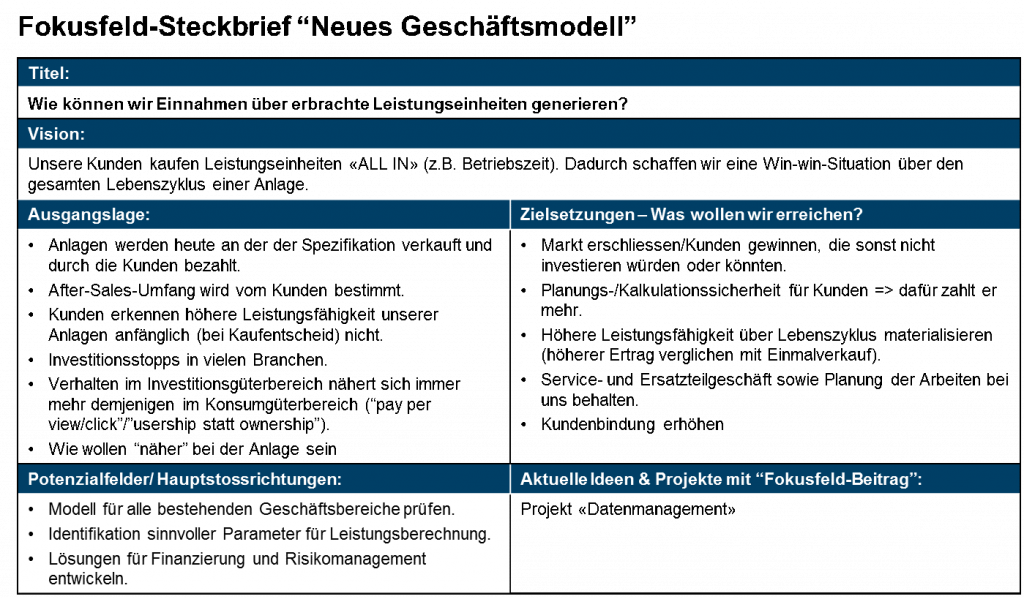
To identify and delineate a strategic focus, a single content, such as a trend, is selected from the innovation architecture, which, from the company’s point of view, opens up opportunities for differentiating innovations. This content then serves as a «driver» or «nucleus» for the strategic focus field. Each content can already be seen as a strategic focus field on its own or, if necessary, supplemented by further contents from other levels, which should sharpen the task in a suitable manner. Since the demarcation of strategic focus areas should be in line with the corporate strategy, appropriate content should already be incorporated here. This procedure is repeated until the most attractive strategic focus areas have been identified. A number of five to a maximum of ten strategic focus areas has proven to be appropriate. The most important facts about each focus field are summarized in a profile.
Depending on the content of the focus fields, we then either enter the eBMC via the customer problem or the technology.
Step 3: Solution-independent customer problem and solution technologies
As part of a first «exploration» of the focus areas, it is about sounding out possible innovation potentials. This primarily includes the concretization of solution-independent customer problems in the sense of articulated or inarticulate customer needs. In doing so, it is possible to fall back on proven methods of innovation management in the early stages. Possible meaningful approaches include: lead user workshops with selected customers and sales partners, customer process analyzes, customer observations, in-depth interviews with customers, critical event method (CIT), frequency relevance analysis of events / problems and complaints, internal ideas competitions, open innovation Activities (eg public competitions), benchmarking days, business model confrontation or trend scouting. These are entered in the corresponding field of the eBMC. At the same time – as far as possible – ideas for solution technologies are developed and also recorded in the eBMC. Here, too, can be built on proven methods and concepts such as the S-curve, the Gartner hype cycle or technology radars.
Step 4: Customer Groups and Products
In the next step, the idea will be given further contours by, on the one hand, sharpening the profile of potential customers and, on the other hand, putting the offer together. Osterwalder’s «Value Proposition Design» approach provides valuable assistance in this regard. He assumes that the customer profile can be derived from the «jobs-to-be-done» of the customer as well as the pains and gains in the fulfillment of the tasks. From the considerations to possible «pain relievers», so solution elements for the reduction of the Pains and «Gain-Producers, so solution elements, which are able to donate a customer use, finally the product can be designed. By a product we mean everything that the company «produces» and donates to the customer for money. This includes haptic products, services, services and everything that is today called New German word creations such as «value proposition», «value proposition» and other terms
Complete the remaining fields for the eBMC
On the basis of technologies, customer benefit and offer, the other fields of the eBMC are filled up according to the already classic pattern.
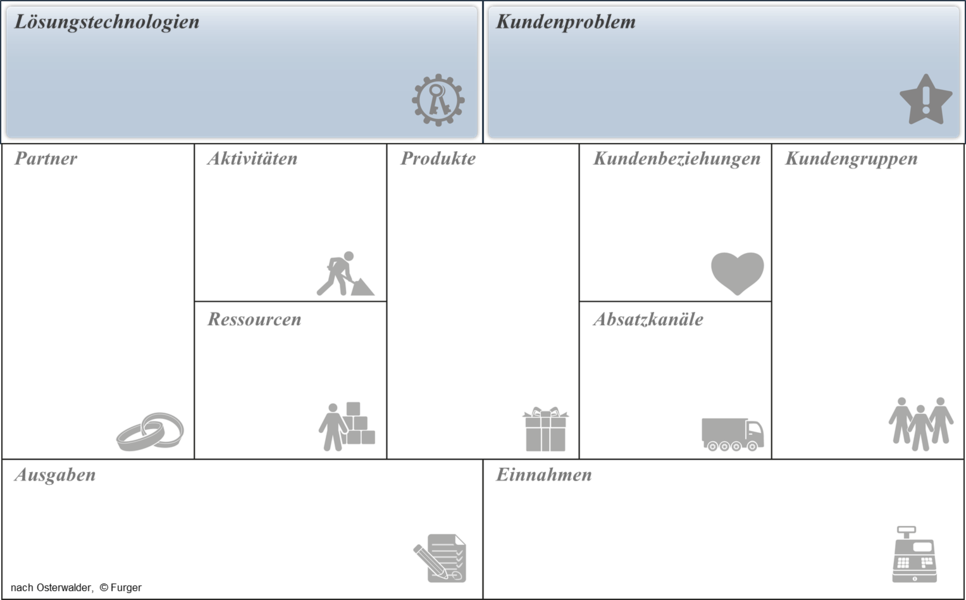
Step 5: Partners, Resources, Activities
No company is alone in the market. List the partners you work with here. This is best done along the value chain; So from the purchase of materials and services on the service to sales; Marketing and communication with the customers, also record the services provided by the partners.
The resources used to create the market offer the following categories: the physical resources (premises, production machines), the intellectual resources (knowledge, patents, partnerships, customer base), the human resources (employees) and the financial resources (available capital, securities).
The key activities describe the processes and competencies needed to ensure service delivery. Again, we cover the entire value chain, which we serve from – to marketing and sales.
Step 6: Customer Groups, Customer Relationship, Sales Channels
Customers can often be divided into groups or segments. In many cases, segmentation also serves for the division into business segments. We recommend equal quantification of these groups, i. with which groups which turnover or even better, which profit is achieved. A good instrument for this is the classic ABC analysis.
The customer relationship also determines the communication with the customer. Between intensive collaboration e.g. There is a whole range of possible relationships with joint developments and pure marketing of the products. Depending on the intensity of the marketing is adjusted accordingly
The sales channels determine how the products or offers come to the customer. Distribution, online channels and points of sale form the interfaces of a company to the target customers.
Step 7: Expenditure
The most important cost factors of a business model are summarized here.
Step 8: Revenue
Here, pricing models and pricing strategies (one-time payment, subscription) are described.
Step 9: Integrate the innovations into the corporate strategy
We can now directly derive the measures from the eBMC for the implementation. If we have highlighted the «new» elements in color, they can easily be formulated.
Alternatively, we can now embed the result in the corporate strategy and develop options, strategic directions with quantitative targets. These then lead to concrete measures and form part of the strategy that will be implemented and accompanied by strategic controlling.
eBMC in the STRATEGY.APP
For each business area, we create the eBMC with the current key elements. Each module is filled accordingly and can be adapted, printed or otherwise communicated at any time:
The individual blocks and elements are entered in the usual editing window:
In the design phase, we can now add additional key elements; here e.g. as a new technology, the «nanotechnology» applied to the coating of the glass; or a new sales channel with which customers will be served in the future:
The new elements appear in red for identification. This provides us with a basis for deriving new strategic options and developing strategic directions and measures.
These are then listed in parallel with the options derived from the SWOT.
Here, too, options can be added, added, stopped or deleted at any time.
Literature: « Wunderwaffe Innovation «By Beat Birkenmeier and Harald Brodbeck
Learn more about « Innovation Architecture » at:
beat.birkenmeier@gronova.com +41 41 727 04 70
White Paper: Strategic Success Potentials in Times of Disruption
Part 1 of 2
Just as operational management has its controlling or core figures in annual or quarterly earnings figures, so too does its strategic management. The most important control variables here are the market position, the cost position and the customer benefit. Add to this the handling of new technologies and here come S-curves and disruption into the game. The interplay of these variables allows us to derive the success potential and thus the future viability of a company.
Download this page as PDF
Strategic success potentials
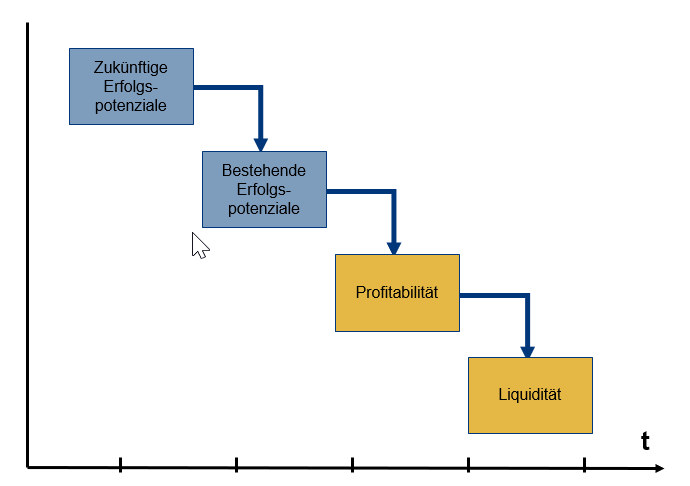
Success potentials are all the prerequisites and abilities of a company, with which the results of the enterprise are achieved. Gälweiler differentiates here by distinguishing between current and future potential for success.
Today’s potential for success
Today’s or existing potential for success forms the basis for the medium-term success of the company. The most important key figures for this are the market position and the cost position. However, these key figures are not sufficiently informative about the long-term success and survival of the company.
Future success potential
Future success potential ensures that a company can remain successful in the long term. The central control parameters for this are the «solution-independent customer problem» and «new technologies». The building up of future success potentials is attributed to the strategic management. Essentially, the development of future success potentials corresponds to innovation and thus to strategic innovation management.
«Strategic corporate governance as a precontrol task with regard to the subsequent realization of success therefore consists of the search, creation and maintenance of high and secure success potentials, which always includes the timely location of innovation potential.»
(A. Gälweiler, 1987)
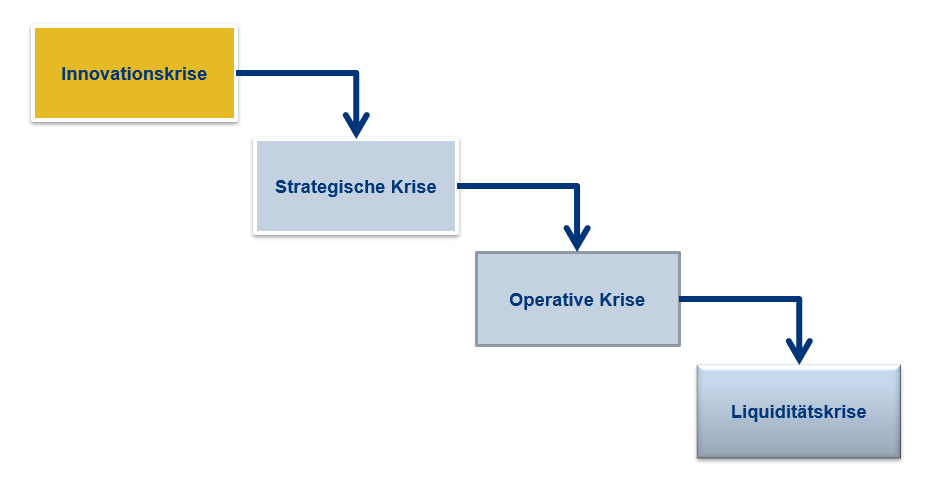
The different crises of a company
According to this logic, corporate crises can be classified:
- If a company lacks the liguidity, it is technically bankrupt and one calls this the «liquidity crisis». This happens to many startups – although you have good business models and a lot of potential when you run out of money, that’s over
- The operating crisis or earnings crisis occurs when the profit is down or negative. This is not the death of a company. As long as money is there, it can survive and if the strategy is right, it will even be back in the black.
- The strategic crisis is defined by a poor market and cost position. The gain may still be positive, but the future is endangered.
- The innovation crisis will only take effect in a few years, when new solutions based on new technologies begin to substitute our products and services.
Gälweiler on operational key performance indicators versus strategic success factors
Quotes from A. Gaelweiler: Strategic Management, 1987
- The autonomy of strategic corporate management lies above all in its independent orientation. (P. 26)
- The autonomy of strategic corporate management lies above all in its independent orientation (p. 26) Operational business data, as important and irreplaceable as they are for running the day-to-day business, often leaves the actual strategic problems of a business venture in one Light that does not correspond to the real strategic conditions. Therefore results and data of the current business usually lead to a strategically wrong behavior. (P. 25)
- Success data are relatively ineffective and often totally misleading as a basis for strategic corporate governance. (P. 30)
- The signals emanating from the short-lived success data are usually not only too late. Too often, they also mislead to acting in a long-term, wrong-pointing direction without first being noticed. (Pp. 240 f.)
- Last but not least, therefore, the fundamental importance of the strategic management task lies in the fact that wrong decisions and omissions are generally no longer correctable or recoverable if they only become noticeable at the time of the operational implementation of the success data. (P. 26)
The current success potentials and their control parameters
According to Gälweiler, today’s potential for success is derived from the control factors of the cost position and the market position. From our point of view, it is indispensable to include the area of employees as a further position for control variables. Our experience shows that this as a strategic success potential also plays a crucial role.
Market position
The control parameters of the market position include the following factors:
- Absolute market share
- Relative market share (in relation to the 3 biggest competitors)
- Customer loyalty
- Customer Value
- Relative Qualitä
- Image
- entry barriers
These figures show whether your own market position can be maintained and defended, or expanded.
Cost position
The control variables of the cost item are the various types of productivity. The continuous optimization of structures and processes comes into play here:
- Productivity of knowledge
- Productivity of the invested capital
- Productivity of employees
Know-how Position
The active involvement of employees in corporate development releases strong and often unimaginable energies and decisively supports the development of factors such as:
- Know-how
- Core competences
- Motivation and commitment
- Creativity and new ideas
Future success potentials and their control variables
Gälweiler derives the future potential for success from the control parameters of customer benefits and technologies.
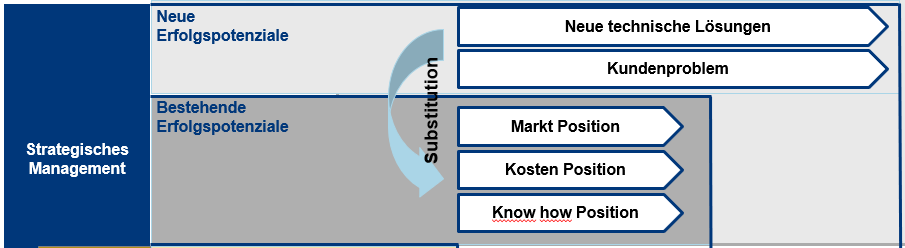
Customer benefits
Customer value is the anchor for any corporate strategy; And this is about the original customer problem, detached from the product or offer. We also refer to this as a «solution-independent customer problem». Whether you prefer to call the customer problem a customer request or a customer need, leave it to them. We treat these three terms as synonyms.
Here are the questions:
- What does the customer really pay for?
- For what does he put the money on our counter and not go to the competition?
A detailed description of this topic can be found in our whitepaper «Customer Benefits».
Technologies
All technologies have a limited lifetime because they are replaced by new and improved technologies. There are on the one hand gradual improvements and optimizations of existing technologies, on the other hand quantum leaps, with which a new technology replaces the existing solutions within a short time. Not only does it offer improved solutions, it also offers completely new applications that are better for the customer. These are e.g. the automobile with the internal combustion engine opposite the horse-drawn carriages or the email via the Internet opposite the letter post. As control parameters of the technologies the questions after the
- right key technologies
- the life phase of an existing key technology
- the advent of new technologies
- your own core competencies
- the substitution of existing products and solutions
Disruption and S-curve
Here we find the basis of what is being discussed and treated nationwide under the term «disruption»: the S-curve.
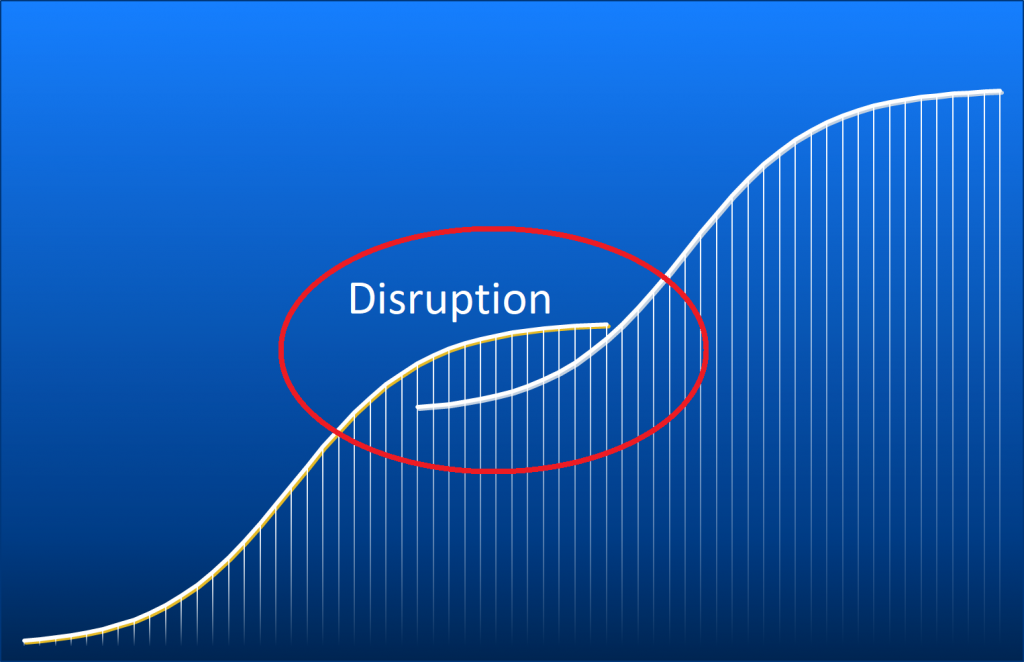
The expiration of a technology while at the same time a new technology spreads, shows the emergence of future success potentials. Existing products are substituted by new offers according to the pattern of the S-curves.
In the next whitepaper, we will discuss it in detail and introduce the S-curve tool in more detail.
Download this page as PDF
Ignaz Furger
Furger and Partner Inc Strategy Development Hottingerstrasse 21 CH – 8032 Zurich +41 44 251 8070 furger@furger-partner.ch www.strategy.app
Whitepaper: Strategische Erfolgspotenziale in Zeiten der Disruption
Teil 1 von 2
So wie das operative Management in den Ergebniszahlen auf Jahres- oder Quartalsebene seine Steuerungs- oder Kerngrössen hat, gibt es diese auch für das strategische Management. Als wichtigste Steuerungsgrössen gelten hier die Marktposition, die Kostenposition und der Kundennutzen. Dazu kommt der Umgang mit neuen Technologien und hier kommen S-Kurven und Disruption ins Spiel. Aus dem Zusammenspiel dieser Grössen lassen sich die Erfolgspotenziale und damit die Zukunftsfähigkeit eines Unternehmens ableiten.
Strategische Erfolgspotenziale
Erfolgspotenziale sind sämtliche Voraussetzungen und Fähigkeiten eines Unternehmens, mit denen die Ergebnisse des Unternehmens erzielt werden. Gälweiler nimmt hier eine Differenzierung vor, indem er zwischen heutigen und zukünftigen Erfolgspotenzialen unterscheidet.
Heutige Erfolgspotenziale
Heutige oder bestehende Erfolgspotenziale sind die Basis für den mittelfristigen Erfolg des Unternehmens. Wichtigste Kennzahlen dafür sind die Marktposition und die Kostenposition. Über den langfristigen Erfolg und Fortbestand des Unternehmens sind diese Kennzahlen aber zu wenig aussagekräftig.
Zukünftige Erfolgspotenziale
Zukünftige Erfolgspotenziale sorgen dafür, dass ein Unternehmen langfristig erfolgreich bleiben kann. Die zentralen Steuerungsgrössen dafür sind das «lösungsunabhängige Kundenproblem» sowie «neue Technologien». Der Aufbau von zukünftigen Erfolgspotenzialen wird der strategischen Unternehmensführung zugerechnet. Im Wesentlichen entspricht die Entwicklung zukünftiger Erfolgspotenziale der Innovation und somit dem strategischen Innovationsmanagement.
«Die strategische Unternehmensführung als eine Vorsteuerungsaufgabe in Bezug auf die spätere Erfolgsrealisierung besteht daher aus der Suche, Schaffung und Erhaltung hoher und sicherer Erfolgspotenziale, was stets das rechtzeitige Orten von Innovationspotenzialen einschliesst.»
(A. Gälweiler, 1987)
Die unterschiedlichen Krisen eines Unternehmens
Nach dieser Logik lassen sich Unternehmenskrisen klassifizieren:
- Fehlt einem Unternehmen die Liquidität, ist es technisch Bankrott und man nennt das die «Liquiditätskrise». Dies passiert vielen Startups – obwohl Sie gute Geschäftsmodelle und viel Potenzial haben, wenn ihnen das Geld ausgeht, ist Schluss
- Die operative Krise oder die Ergebniskrise stellt sich ein, wenn der Gewinn ausfällt oder negativ ist. Das ist noch nicht der Tod eines Unternehmens. Solange Geld da ist kann es überleben und wenn die Strategie stimmt, wird es sogar wieder einmal schwarze Zahlen schreiben.
- Die strategische Krise definiert sich durch eine schlechte Markt- und Kostenposition. Der Gewinn mag noch positiv sein, aber die Zukunft ist gefährdet.
- Die Innovationskrise wirkt sich erst in ein paar Jahren aus, nämlich dann, wenn neue Lösungen auf der Basis von neuen Technologien unsere Produkte und Angebote anfangen zu substituieren.
Gälweiler über operative Erfolgskennzahlen versus strategische Erfolgsfaktoren
Zitate aus A. Gälweiler: Strategische Unternehmensführung, 1987
- Die Eigenständigkeit der strategischen Unternehmensführung besteht vor allem in ihren eigenständigen Orientierungsgrundlagen. (S. 26)
- Operative Geschäftsdaten, so wichtig und unersetzlich sie für die Führung des laufenden Geschäftes sind, lassen nicht selten die eigentlichen strategischen Probleme einer Unternehmung in einem Licht erscheinen, das den wirklichen strategischen Gegebenheiten nicht entspricht. Ergebnisse und Daten des laufenden Geschäftes verleiten daher meistens auch zu einem strategisch falschen Verhalten. (S. 25)
- Erfolgsdaten sind als Orientierungsgrundlagen für die strategische Unternehmensführung relativ wirkungslos und oftmals total irreführend. (S. 30)
- Die von den kurzlebiger gewordenen Erfolgsdaten ausgehenden Signale kommen meistens nicht nur zu spät. Allzu häufig verleiten sie auch zum Handeln in eine langfristig sich als falsch herausstellende Richtung, ohne dass man das zunächst bemerkt. (S. 240 f.)
- Nicht zuletzt beruht deshalb die fundamentale Bedeutung der strategischen Führungsaufgabe darin, dass Fehlentscheidungen und Versäumnisse in der Regel dann nicht mehr korrigierbar oder nachholbar sind, wenn sie erst im Zeitpunkt des operativen Vollzuges an den Erfolgsdaten bemerkbar werden. (S. 26)
Die heutigen Erfolgspotenziale und ihre Steuerungsgrössen
Die heutigen Erfolgspotenziale leiten sich gemäss Gälweiler aus Steuerungsgrössen der Kostenposition und der Marktposition ab. Aus unserer Sicht ist es unerlässlich, als weitere Position für Steuerungsgrössen den Bereich der Mitarbeiter einzubeziehen. Unsere Erfahrung zeigt, dass diesem als strategisches Erfolgspotenzial ebenfalls eine entscheidende Rolle zukommt.
Marktposition
Die Steuerungsgrössen der Marktposition umfassen die folgenden Faktoren:
- Absoluter Marktanteil
- Relativer Marktanteil (im Verhältnis zu den 3 grössten Konkurrenten)
- Kundenbindung
- Kundennutzen
- Relative Qualität
- Image
- Eintrittsbarrieren
Diese Kennzahlen zeigen, ob die eigene Marktposition gehalten und verteidigt, bzw. ausgebaut werden kann.
Kostenposition
Als Steuerungsgrössen der Kostenposition wirken die verschiedenen Arten von Produktivität. Zum Tragen kommt hier die kontinuierliche Optimierung der Strukturen und Prozesse:
- Produktivität des Wissens
- Produktivität des eingesetzten Kapitals
- Produktivität der Mitarbeiter
Know-how Position
Der aktive Einbezug der Mitarbeiter in die Unternehmensentwicklung setzt starke und oft ungeahnte Energien frei und unterstützt entscheidend den Aufbau von Faktoren wie:
- Know-how
- Kernkompetenzen
- Motivation und Engagement
- Kreativität und neue Ideen
Die zukünftigen Erfolgspotenziale und ihre Steuerungsgrössen
Die zukünftigen Erfolgspotenziale leitet Gälweiler aus den Steuerungsgrössen von Kundennutzen und Technologien ab.
Kundennutzen
Der Kundennutzen ist der Ankerhaken für jede Unternehmensstrategie; und zwar geht es hier, um das originäre Kundenproblem, losgelöst vom Produkt oder Angebot. Wir bezeichnen das auch als «lösungsunabhängiges Kundenproblem». Ob Sie das Kundenproblem lieber als Kundenwunsch oder als Kundenbedürfnis bezeichnen, sie Ihnen überlassen. Wir behandeln diese drei Begriffe als Synonyme.
Hier geht es um die Fragen:
- Für was bezahlt der Kunde wirklich?
- Für was legt er das Geld auf unsere Theke und geht nicht zur Konkurrenz?
Eine detaillierte Beschreibung dieses Themas finden Sie in unserem Whitepaper «Kundennutzen».
Technologien
Alle Technologien haben eine beschränkte Lebenszeit, weil sie jeweils durch neue und verbesserte Technologien abgelöst werden. Es gibt einerseits schrittweise Verbesserungen und Optimierungen von bestehenden Technologien, andererseits Quantensprünge, mit denen einen neue Technologie die bestehenden Lösungen innerhalb von kurzer Zeit ablöst. Sie bietet nicht nur verbesserte Lösungen, sondern ganz neue Anwendungen, die für den Kunden um Faktoren besser sind. Es sind dies z.B. das Automobil mit dem Verbrennungsmotor gegenüber den Pferdekutschen oder das Email per Internet gegenüber der Briefpost. Als Steuerungsgrössen der Technologien stellen sich die Fragen nach den
- richtigen Schlüsseltechnologien
- der Lebensphase einer bestehenden Schlüsseltechnologie
- dem Aufkommen von neuen Technologien
- den eigenen Kernkompetenzen
- der Substitution von bestehenden Produkten und Lösungen
Disruption und S-Kurve
Hier finden wir die Basis von dem, was heute landauf landab unter dem Begriff «Disruption» diskutiert und behandelt wird: Die S-Kurve.
durch eine völlig neue Basistechnologie
Das Auslaufen einer Technologie während sich gleichzeitige eine neue Technologie ausbreitet, zeigt die Entstehung zukünftigen Erfolgspotenziale. Bestehende Produkte werden gemäss dem Muster der S-Kurven durch ne ue Angebote substituiert.
Im nächsten Whitepaper werden wir detailliert darauf eingehen und das Tool S-Kurve näher vorstellen.
Ignaz Furger
Furger und Partner AG Strategieentwicklung
Giessentrum
CH – 8600 Dübendorf
+41 44 251 8070
furger@furger-partner.ch
www.strategy.app
Whitepaper Die eBMC als Umsetzungsinstrument für die Innovationsarchitektur
Der Innovationsturbo
Wir haben einmal einen Versuch gestartet und die Ergebnisse aus der Innovationsarchitektur in die eBMC abgefüllt. Und siehe da, jetzt hatten wir eine stabile Basis, auf der sich Innovationen, Stossrichtungen und Massnahmen ableiten liessen; fast schon so, wie in einer richtigen Strategie.
Whitepaper herunterladen
Das geht folgendermassen:
Die Innovationsarchitektur als Grundlage für die Abgrenzung von strategischen Fokusfeldern
Die „Innovationsarchitektur“ dient dazu, den Innovationserfolg unter Berücksichtigung von gesellschaftlichen Trends und der Nutzung neuer Technologien zu steigern, indem sie eine gleichzeitige Berücksichtigung beziehungsweise Abstimmung von Markt-, Produkt- und Technologieaspekten ermöglicht.
Die verschiedenen Betrachtungsebenen der Architektur hängen sowohl aus Markt- als auch aus Technologiesicht logisch zusammen und bedingen sich gegenseitig: Auf der einen Seite wirken Trends auf die Märkte beziehungsweise auf das Verhalten von aktuellen und potenziellen Kunden ein. Konkret äussert sich der Einfluss von Trends in spezifischen Kundenaufgaben und -bedürfnissen. Diese zu befriedigen stellt das oberste Ziel der Gestaltung des Marktangebots, d.h. Produkte, Services oder Geschäftsmodelle, dar. Zur Bereitstellung dieses Angebots sind auf der anderen Seite Kompetenzen oder Technologien erforderlich. Sie erfüllen – abstrakt formuliert – diejenigen Funktionen, welche zur Befriedigung der Kundenbedürfnisse notwendig sind.
Bei einer Betrachtungsweise „vom Markt her“, im Marketing auch bekannt als „Market Pull“, wird deshalb versucht, das eigene Marktangebot möglichst optimal auf die Bedürfnisse in den Märkten auszurichten. Ein wesentliches Merkmal dieser Sichtweise besteht darin, dass die Kunden, die man bedienen will, zumindest ansatzweise bekannt sind. Bei der Betrachtung „von der Technologie bzw. Kompetenz her“, auch bekannt als „Technology Push“, ist dies nicht zwingend der Fall sein. Vielmehr steht hier die Frage im Vordergrund, welche Bedürfnisse in neuen Märkten auf der Basis der verfügbaren Kompetenzen befriedigt werden könnten.
Befüllt man nun die einzelnen Ebenen der „Innovationsarchitektur“ mit konkreten Inhalten, so erhält man eine geeignete Grundlage für die Ableitung sogenannter „strategischer Fokusfelder“ für Innovation. Dabei handelt es sich – etwas abstrakt formuliert – um Suchfelder zur Hebung von Innovationspotenzialen, welche über einen längeren Zeitraum als Quelle für neue Marktleistungen bzw. Angebote dienen .Innerhalb dieser Felder wird nun aktiv nach Innovationschancen und entsprechenden Lösungen gesucht . Oder etwas konkreter: Felder, innerhalb derer ein Unternehmen Innovation betreiben will.
Die Eingrenzung eines strategischen Fokusfeldes ist dabei nicht absolut, aber sie gibt jedem Unternehmen einen Rahmen, um die Chancen für erfolgreiche Innovationen zu erhöhen und die Risiken zu minimieren.
Was machen wir mit dem Ergebnis?
Die Identifikation strategischer Fokusfelder bildet die Basis, um die eBMC zu füllen:
- Wir können pro Fokusfeld eine eBMC erstellen oder auch mehrere davon kombinieren. Voraussetzung ist, dass sich daraus zumindest eine Geschäftsidee erstellen lässt.
- Dann setzen wir auf der einen Seite die Kundenkriterien zusammen. Dazu verwenden wir gängige KN-Tools, wie z.B. die Kundennutzenanalyse oder das Value Proposition Canvas (VPC). Die Auswertung der Kundenprobleme – Kundenbedürfnisse – Kundennutzenkriterien hilft, das Angebot vom Markt her genau zu definieren und festzulegen.
- Auf der anderen Seite erfassen wir alle dazu notwendigen Schlüsseltechnologien.
- Die Beschreibung des Produktes bzw. der Angebots ist die Ableitung aus Kundennutzen und Technologien. Sie ist die Lösung, für die der Kunde zu zahlen bereit ist. Diese Lösung hat jetzt nicht nur eine beliebige Herleitung, sondern ist strategisch eingebettet, oder auf Neudeutsch: wir haben einen «STRATEGISCHEN-FIT».
- Jetzt geht es noch darum, die restlichen Felder der eBMC auszufüllen, entweder mit schon vorhandenen Elementen oder mit solchen, die neu geschaffen werden müssen. Wir empfehlen, neue Elemente farblich abzuheben. Daraus lassen sich dann direkt Sofortmassnahmen ableiten.
- Jetzt betten wir das Ergebnis in die Unternehmensstrategie ein und legen die Optionen, Stossrichtungen und Massnahmen fest und fertig ist das Rezept.
Das Vorgehen Schritt für Schritt
Schritt 1: Erstellen der Innovationsarchitektur
Beim Erstellen der Innovationsarchitektur geht es darum, die oben erwähnten Ebenen mit konkretem, für das eigene Unternehmen relevantem, Inhalt zu füllen. Folgendes Vorgehen hat sich bewährt:
- Initiales Befüllen der einzelnen Ebenen: Dies geschieht durch die Sammlung bereits bestehender Analysen aus Markt- und Technologiesicht sowie dem Abgleich mit der Unternehmensstrategie.
- Durchführung ergänzender innovationsstrategischer Analysen zur Schliessung noch bestehender Lücken in der Innovationsarchitektur: Hierfür bieten sich zum einen teilstandardisierte Interviews mit der Geschäftsleitung sowie Schlüsselpersonen aus den Bereichen Markt, Technologie und Produkt an. Zum anderen werden entlang von strukturierten Arbeitsanleitungen gezielte Analysen durchgeführt. Diese dienen der Ermittlung z.B. der eigenen Kernkompetenzen, zukünftiger Kundenanforderungen, relevanter Megatrends und deren Konsequenzen, sowie neuer Technologien mit Relevanz für das Unternehmen.
- Aufstellen der Innovationsarchitektur: Die erarbeiteten Ergebnisse werden fortlaufend den einzelnen Ebenen der Innovationsarchitektur zugordnet, bis das Bild aus Sicht des Kernteams vollständig ist. Die Kunst ist das Finden einer für die weitere Bearbeitung geeigneten Granularität – nicht zu generisch, aber auch nicht zu detailliert. In der Praxis haben sich Ergebnisse bewährt, die aus 40 bis maximal 70 Elementen bestehen.
Bevor die weiteren Arbeiten gestartet werden sollte die Innovationsarchitektur von der Geschäftsleitung als geeignete Basis für die nächsten Schritte verabschiedet werden. Dazu gehören ein Check der inhaltlichen Vollständigkeit und Güte sowie der Granularität. Die folgende Abbildung zeigt eine verabschiedete Innovationsarchitektur eines Herstellers von Chemielabor-Geräten:
Schritt 2: Identifikation von strategischen Fokusfeldern
Zur Identifikation und Abgrenzung eines strategischen Fokusfeldes wird zunächst ein einzelner Inhalt, zum Beispiel ein Trend, aus der Innovationsarchitektur ausgewählt, welcher aus Sicht des Unternehmens Chancen für differenzierende Innovationen eröffnet. Dieser Inhalt dient sodann als „Treiber“ oder „Nukleus“ für das strategische Fokusfeld. Jeder Inhalt kann dabei bereits für sich alleine gesehen ein strategisches Fokusfeld darstellen oder bei Bedarf zur Konkretisierung durch weitere Inhalte aus anderen Ebenen ergänzt werden, welcher die Aufgabenstellung in geeigneter Weise schärfen sollen. Da die Abgrenzung strategischer Fokusfelder in Einklang stehen soll mit der Unternehmensstrategie, sollten entsprechende Inhalte hier bereits einfliessen. Dieses Vorgehen wird solange wiederholt, bis die attraktivsten strategischen Fokusfelder ermittelt sind. Eine Anzahl von fünf bis maximal zehn strategischen Fokusfeldern hat sich dabei als zweckmässig erwiesen. Die wichtigsten Fakten zu jedem Fokusfeld werden dabei in einem Steckbrief zusammengefasst.
Je nach Inhalt der Fokusfelder steigen wir im Anschluss entweder über das Kundenproblem oder die Technologie in die eBMC ein.
Schritt 3: Lösungsunabhängiges Kundenproblem und Lösungstechnologien
Im Rahmen einer ersten „Exploration“ der Fokusfelder geht es darum, mögliche Innovationspotentiale auszuloten. Dies umfasst primär die Konkretisierung von lösungsunabhängigen Kundenproblemen im Sinne von artikulierten oder unartikulierten Kundenbedürfnissen. Dabei kann auf bewährte Methoden des Innovationsmanagements in den frühen Phasen zurückgegriffen werden. Mögliche sinnvolle Ansätze sind z.B.: Lead User-Workshops mit ausgewählten Kunden und Vertriebspartnern, Kundenprozessanalysen, Kundenbeobachtungen, Tiefeninterviews mit Kunden, Methode der kritischen Ereignisse (CIT), Frequenz-Relevanz-Analysen von Ereignissen/Problemen und Beschwerden, interne Ideenwettbewerbe, Open Innovation-Aktivitäten (z.B. öffentliche Wettbewerbe), Benchmarking Days, Geschäftsmodell-Konfrontation oder Trendscouting. Diese werden in das entsprechende Feld des eBMC eingetragen. Gleichzeitig werden – soweit möglich – Ideen für Lösungstechnologien entwickelt und ebenfalls im eBMC festgehalten. Auch hier kann auf bewährte Methoden und Konzepte wie die S-Kurve, den Gartner-Hype-Cycle oder Technologie-Radars aufgebaut werden.
Schritt 4: Kundengruppen und Produkte
Im nächsten Schritt werden der Idee weitere Konturen verliehen, indem einerseits das Profil möglicher Kunden geschärft und andererseits das Angebot geschnürt wird. Hierzu liefert Osterwalders Ansatz des „Value-Proposition-Designs“ eine wertvolle Hilfestellung. Er geht davon aus, dass sich das Kundenprofil aus den „Jobs-to-be-done“ des Kunden sowie den Pains und Gains bei der Erfüllung der Aufgaben herleiten lässt. Aus den Überlegungen zu möglichen „Pain-Relievern“, also Lösungselementen zur Minderung der Pains und „Gain-Producers, also Lösungselementen, welche einen Kundennutzen zu stiften vermögen, lässt sich schliesslich das Produkt gestalten. Unter einem Produkt verstehen wir dabei alles, was das Unternehmen «produziert» und für Geld an den Kunden abgibt. Dies umfasst haptische Produkte, Dienstleistungen, Services und alles, was heute mit neudeutschen Wortschöpfungen wie «Wertangebot», «Value Proposition» und anderen Begriffen bezeichnet wird
Ergänzen der restlichen Felder für die eBMC
Auf der Basis Technologien, Kundennutzen und Angebot werden die weiteren Felder der eBMC nach dem schon klassischen Muster aufgefüllt.
Schritt 5: Partner, Ressourcen, Aktivitäten
Kein Unternehmen ist alleine am Markt tätig. Führen Sie hier die Partner auf, mit denen Sie zusammenarbeiten. Am besten geschieht das entlang der Wertschöpfungskette; also vom Einkauf von Material und Dienstleistungen über die Leistungserstellung bis hin zum Vertrieb; Marketing und Kommunikation mit den Kunden, Erfassen Sie auch die Leistungen, die von den Partnern erbracht werden.
Die Ressourcen zur Erstellung des Marktangebots umfassen folgende Kategorien: die physische Ressourcen (Räumlichkeiten, Produktionsmaschinen), die intellektuelle Ressourcen (Wissen, Patente, Partnerschaften, Kundenstamm), die personelle Ressourcen (Mitarbeiter) sowie die finanzielle Ressourcen (verfügbares Kapital, Sicherheiten).
Mit den Schlüsselaktivitäten beschreiben wir die Prozesse und Kompetenzen, die notwendig sind, Leistungserstellung zu gewährleisten. Auch hier decken wir die ganze Wertschöpfungskette, die wir bedienen ab – bis hin zum Marketing und Vertrieb.
Schritt 6: Kundengruppen, Kundenbeziehung, Absatzkanäle
Die Kunden lassen sich vielfach in Gruppen oder Segmente einteilen. Vielfach dient Segmentierung auch für die Einteilung in Geschäftsfelder. Wir empfehlen, diese Gruppen gleich zu quantifizieren, d.h. mit welchen Gruppen wird welcher Umsatz oder noch besser, welcher Gewinn erzielt. Ein gutes Instrument dafür ist die klassische ABC-Analyse.
Die Kundenbeziehung bestimmt auch die Kommunikation mit dem Kunden. Zwischen einer intensiven Zusammenarbeit z.B. mit gemeinsamen Entwicklungen und einer reinen Vermarktung der Produkte besteht eine ganze Bandbreite von möglichen Beziehungen. Je nach Intensität wird auch das Marketing entsprechend angepasst
Die Absatzkanäle bestimmen, wie die Produkte oder Angebote zum Kunden kommen. Distribution, Online-Kanäle und Verkaufsstellen bilden die Schnittstellen eines Unternehmens zu den Zielkunden.
Schritt 7: Ausgaben
Die wichtigsten Kostenfaktoren eines Geschäftsmodells werden hier zusammengefasst.
Schritt 8: Einnahmen
Hier werden Preismodelle und der Preisstrategien (Einmalzahlung, Abonnement) beschrieben.
Schritt 9: Einbinden der Innovationen in die Unternehmensstrategie
Wir können nun für die Umsetzung direkt die Massnahmen aus der eBMC ableiten. Wenn wir die «neuen» Elemente farblich abgehoben haben, lassen sich diese leicht ausformulieren.
Alternativ können wir jetzt das Ergebnis in die Unternehmensstrategie einbetten und Optionen, Stossrichtungen mit quantitativen Zielen erarbeiten. Diese münden dann in konkrete Massnahmen und stellen einen Teil der Strategie dar, die in die Umsetzung geht wird und mit dem strategischen Controlling begleitet wird.
eBMC in der STRATEGY.APP
Für jedes Geschäftsfeld erstellen wir bei den Vorgaben die eBMC mit den aktuellen Schlüsselelementen. Jeder Baustein wird entsprechen gefüllt und kann jederzeit angepasst, ausgedruckt oder sonst kommuniziert werden:
Die Eingabe der einzelnen Bausteine und Elemente erfolgt im gewohnten Editierfenster:
In der Phase Gestaltung können wir nun zusätzliche Schlüsselelemente hinzufügen; hier z.B. als neue Technologie die „Nanotechnologie“, die für die Beschichtung des Glases angewendet wird; oder ein neuer Absatzkanal, mit dem die Kunden in Zukunft bedient werden sollen:
Die neuen Elemente erscheinen zur Kennzeichnung in roter Farbe. Damit haben wir eine Basis, um neue strategische Optionen abzuleiten und zu Stossrichtungen und Massnahmen auszuarbeiten.
Diese werden dann parallel zu den Optionen aufgelistet, die aus der SWOT abgeleitet werden.
Auch hier können Optionen jederzeit ergänzt, hinzugefügt oder gestoppt bzw. gelöscht werden.
Whitepaper herunterladen
Literatur: „Wunderwaffe Innovation“ von Beat Birkenmeier und Harald Brodbeck
Weitere Informationen zum Thema «Innovationsarchitektur» unter:
beat.birkenmeier@gronova.com
+41 41 727 04 70
Whitepaper Innovationsmanagement mit der «erweiterten Business Model Canvas» (eBMC)
Von der BMC zur eBMC
Vergleicht man die Business Model Canvas mit dem Navigationssystem von Aloys Gälweiler, sieht man, dass dort auf der obersten Ebene die Innovation dargestellt wird, und zwar mit den beiden Bausteinen „lösungsunabhängiges Kundenproblem“ und „Lösungstechnologie“. Genau diese beiden Bausteine haben wir dann auf die Business Model Canvas gepackt, und damit wird diese erweiterte Business Model Canvas (eBMC) zu einem hervorragenden Instrument für das Innovationsmanagement.
Diese Seite als PDF herunterladen
Der von Alexander Osterwalder veröffentlichte Band „Business Model Generation“ hat in der Berater- und Unternehmerwelt eingeschlagen wie eine Bombe. Das Buch ist praktisch anwendbar, sehr schön gemacht und vor allem ganz anders als alles Bisherige auf dem Gebiet. Und der Erfolg gibt dem Autor Recht.
Als mir ein Kollege zum ersten Mal von diesem Modell erzählt hat, hat mich allerdings von Anfang an etwas irritiert – irgendetwas fehlte doch. Es ist ja nicht so, dass mit dem BMC die Welt neu erfunden wurde. Vieles lässt sich darin aus bekannten Ansätzen und Methoden wiederfinden – oder eben nicht.
Was für mich von Anfang an fehlte, ist der Baustein „Kundenproblem“, und zwar das „lösungsunabhängige Kundenproblem“, wie wir es früher genannt haben. Auf Basis des St. Galler Ansatzes haben wir das Kundenproblem stets klar vom Produkt oder von der angebotenen Dienstleistung selber getrennt.
Das «Lösungsunabhängige Kundenproblem»
Eine Uhr ist ein Produkt mit dem Zweck, die Zeit anzugeben. Das Kundenproblem, nämlich die Zeit zu wissen, besteht allerdings unabhängig von der Uhr und kann auch anders gelöst werden. Dies trifft sogar noch deutlicher zu, wenn die Uhr als Luxusgut oder Statusobjekt angeboten wird. Dann besteht das Kundenproblem darin, sich zu profilieren, und das kann mit vollkommen anderen Angeboten oder „Value Propositions“ gelöst werden.
In der BMC wird das Kundenproblem zusammen mit dem Baustein Produkt dargestellt und dann auf Neudeutsch „Wertangebot“ genannt. Später wurde für den Baustein Kundenproblem und mit Hilfe der sogenannten Empathiekarte (von Xplane) eine separate Canvas entwickelt.
Mir liess dieser Gedanke keine Ruhe und ich beschäftigte mich mit der Frage, wie sich das Canvas-Modell mit dem Kundenproblem ergänzen lässt, ohne dass die logische Einheit und die Symmetrie des Modells zerstört würden. Und wie es manchmal so ist, kommen einem die besten Gedanken dann, wenn man alleine ist: Bei einem ausgedehnten Lauf durch den Wald hatte ich folgende Idee: Nehmen wir doch die oberste Ebene des Navigationssystems von Aloys Gälweiler mit den beiden Bausteinen „lösungsunabhängiges Kundenproblem“ und „Lösungstechnologie“, und packen diese auf die Business-Model-Canvas. Damit wird diese erweiterte Business Model Canvas (eBMC) zu einem hervorragenden Instrument für das Innovationsmanagement.
Somit ergibt sich folgende Kette: Kunde – Kundenproblem – Technologie – Produkt oder wenn Sie es vorziehen: Produkt – Technologie – Kundenproblem – Kunde. Das Bestechende daran ist, dass das Modell schön symmetrisch bleibt und logisch zusammenpasst.
Innovationsmanagement mit der eBMC
Ergänzt mit den beiden Bausteinen aus Gälweilers Navigationssystem, setzen wir das Canvas- Modell vor allem bei der Suche nach neuen Geschäften ein. Damit wird es zu einem hervorragenden Instrument für das Innovationsmanagement. Denn Innovation lässt sich von zwei Seiten her vorantreiben: vom Markt und von der Technologie. Eine gute praktische Anleitung dazu hat Prof. Hugo Tschirky, der an der ETH Zürich lehrt, mit seinem Vorgehen für Innovationsmanagement dargestellt. Wir finden es im Buch „Wunderwaffe Innovation“ von Beat Birkenmeier und Harald Brodbeck. In der Folge werden wir die beiden Bausteine „Kundenproblem“ und „Lösungstechnologien“ genauer erläutern, damit auch Sie die Business Model Canvas entsprechend ergänzen und als Innovationstool einsetzen können
Abbildung 1: die erweiterte Business Model Canvas von Furger und Partner AG mit den Bausteinen «Lösungstechnologien» und «Kundenproblem»
Der Baustein «Kundenproblem»
Dieser Baustein steht für das Kundenproblem, das ein Unternehmen lösen will – und zwar geht es um das „lösungsunabhängige Kundenproblem“. Das heisst, dieses Kundenproblem ist häufig latent vorhanden und wird durch neue Produkte oder Dienstleistungen nur anders und meist besser gelöst.
Hier eine Zwischenbemerkung: Wir benutzen hier die Begriffe „Kundenproblem“ – „Kundenbedürfnis“ und „Kundenwunsch“ als Synonyme. Es ist Ihnen freigestellt, hier Ihren passenden Begriff zu verwenden.
Die Lösung eines Kundenproblems bringt dem Kunden einen Nutzen, und genau für diesen Nutzen ist der Kunde bereit, Geld zu bezahlen. So ist das Produkt „Auto“ nicht in erster Linie eine schön gestaltete Maschine auf vier Rädern, sondern schafft die Möglichkeit, sich jederzeit von A nach B bewegen zu können. Es ist oft nützlich, eine Geschäftsidee auf dieses „Problem“ zu abstrahieren, um auf neue Lösungstechniken zu kommen. Innovation, die sich am Markt orientiert, beschäftigt sich vor allem damit und kann nur funktionieren, wenn man das Kundenproblem genau kennt.
Dabei kann es sich um originäre Probleme handeln wie z. B. Essen und Trinken oder um sekundäre, abgeleitete Probleme wie Luxusgüter, Ferien oder weitere Annehmlichkeiten, die über ein elementares Grundbedürfnis hinausgehen.
Die wichtigsten Fragen zu diesem Baustein:
- Welches Kundenproblem wollen wir lösen oder welches Kundenbedürfnis wollen wir befriedigen?
- Für was bezahlt der Kunde wirklich?
- Welches ist der Hintergrund einer Problemlösung?
- Welches sind die wirklichen Kaufkriterien aus Sicht des Kunden?
- Welche Kaufkriterien werden von unseren Produkten besser abgedeckt?
- Was bringt den Kunden dazu, das Geld bei uns auf den Tisch zu legen statt bei der Konkurrenz?
Instrument Kundennutzenanalyse (Value Proposition)
Die Kundennutzenanalyse ist das didaktisch wohl beste Instrument, um das Unternehmen in seinen Tätigkeiten auf den Kundennutzen zu fokussieren. Das Instrument kann direkt auf dem Baustein Kundenproblem aufgesetzt werden. Damit wird die logische und inhaltliche Verbindung geschaffen zwischen Kundennutzen – Produkten – Kundengruppen.
Auf der Basis von Kaufkriterien wird eine strategische Nutzenkarte erstellt, die zeigt, welche Wettbewerber mit ihren Produkten dem Kunden einen Nutzen bringen. Eine eingehende Beschreibung, das Tool selber und die Anleitung dazu finden Sie unter dem Whitepaper Kundennutzen auf unserem BLOG
Der Baustein «Lösungstechnologien»
Dieser Baustein steht für die technischen Lösungen, die hinter einem Produkt oder einer Dienstleistung stehen. Technologien haben meist einen bestimmten Lebenszyklus und werden nach einer gewissen Zeit von neuen Technologien abgelöst, die ein Kundenproblem besser und günstiger lösen. Damit setzt ein Substitutionsprozess ein, der zur Ablösung bestehender Produkte im Markt führt. Dieser Vorgang folgt im Normalfall dem Muster einer S-Kurve.
Ein Beispiel dafür ist die Substitution von Pferdekutschen durch Automobile. Innovation findet stets im Zusammenspiel zwischen der Kenntnis des originären Kundenproblems und neuen Lösungstechnologien statt. Der Zeitrahmen der Substitution ist unterschiedlich und kann über Jahre gehen. Die erste Darstellung eines neuen Lösungskonzeptes nennt man Invention – Erfindung, während Innovation erst dann vorliegt, wenn sich das Produkt im Markt durchsetzt. Lösungstechnologien können schrittweise Verbesserungen sein oder gänzlich neue Konzepte umsetzen wie z. B. der Laserdrucker oder die Faxtechnologie, die den Telex substituiert hat. Solche gänzlich neuen Ansätze stellen das bestehende Geschäftsmodell vielfach auf den Kopf, was neudeutsch mit dem Begriff „Disruption“ umschrieben wird.
Die wichtigsten Fragen zu diesem Baustein:
- Welche bestehenden Lösungstechnologien stehen hinter den Produkten?
- In welcher Lebensphase befinden sich diese Technologien?
- Wo stehen neue Erfindungen an, und welche Kundenprobleme können damit (viel) besser gelöst werden?
- Wo und in welchen Technologien hat unser Unternehmen Kompetenzen – einen Vorsprung vor der Konkurrenz und damit Kernkompetenzen?
- Bei welchen Kaufkriterien können wir markante Verbesserungen vornehmen?
Instrument Substitutionsanalyse (S-Kurve)
Mit der Substitutionsanalyse lässt sich die Ablösung von bestehenden Produkten oder Technologien durch neue Angebote darstellen.
Dieses Instrument hilft, auf drei Ebenen:
- den optimalen Zeitpunkt für den Einstieg in einen neuen Markt zu finden (oder den Ausstieg)
- Die Wachstumsraten in wachsenden Märkten gegenüber dem Markt und dem Wettbewerber festzulegen.
- Den Übergang in einen Preis- d. h. Kostenmarkt zu planen, und damit die Kostenposition auszuschöpfen oder auszusteigen.
eBMC in der STRATEGY.APP
Für jedes Geschäftsfeld erstellen wir bei den Vorgaben die eBMC mit den aktuellen Schlüsselelementen. Jeder Baustein wird entsprechen gefüllt und kann jederzeit angepasst, ausgedruckt oder sonst kommuniziert werden:
Die Eingabe der einzelnen Bausteine und Elemente erfolgt im gewohnten Editierfenster:
In der Phase Gestaltung können wir nun zusätzliche Schlüsselelemente hinzufügen; hier z.B. als neue Technologie die „Nanotechnologie“, die für die Beschichtung des Glases angewendet wird; oder ein neuer Absatzkanal, mit dem die Kunden in Zukunft bedient werden sollen:
Die neuen Elemente erscheinen zur Kennzeichnung in roter Farbe. Damit haben wir eine Basis, um neue strategische Optionen abzuleiten und zu Stossrichtungen und Massnahmen auszuarbeiten.
Diese werden dann parallel zu den Optionen aufgelistet, die aus der SWOT abgeleitet werden.
Auch hier können Optionen jederzeit ergänzt, hinzugefügt oder gestoppt bzw. gelöscht werden.