Whitepaper Controlling of Assumptions
Controlling of Assumptions
In each strategy definition, assumptions are made on which the development of the strategy is based. Such an assumption may be technological advances such as the digitization. Others are a certain customer behavior towards increasing service demand, economic activity or certain expectations regarding market growth.
The Tasks of assumption controlling are:
Assumption controlling implements a early warning system that detects possible deviations in order to counteract in time.
- The early recognition of external developments that deviate from the assumptions or premises
- Impact Assessment for both qualitative (eg paradigm shift in customer behavior leads to shifts in demand on distribution channels) and quantitative (impact on target revenue, cost items and market shares)
- Introduce corrective action to adapt the strategy to new circumstances
Creating an assumption controlling:
1. Working out the assumptions
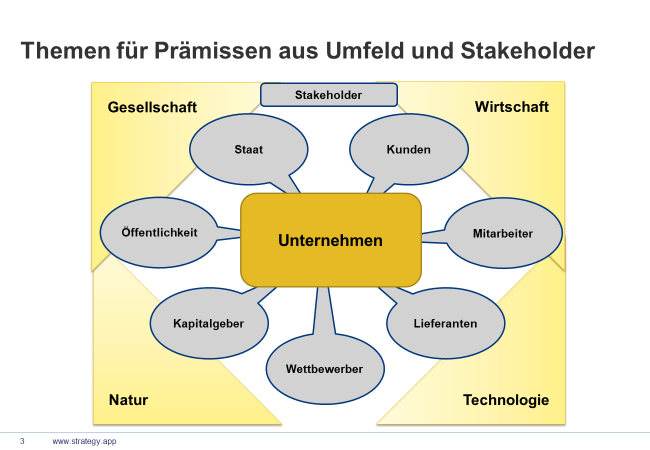
First, we compile those assumptions / premises that play a role in the future development of the company. We assign these premises as follows:
- Environment:
- Society, nature, technology and economy
- Stakeholders:
- Customers, employees, suppliers, investors, competition, public, goverment
We have put together a list of topics. It is the same list from which we also compile the main trends for the SWOT:
Economic environment:
- Global development / economic development of individual regions or national economies
- Fluctuations in international currencies and interest / inflation rates Rise / decrease of country-specific risks
- Customs duties and tariffs / International trade barriers
- Economic integration, e.g. Eurozone
Technological developments
- Development of key technologies
- Digitization / Internet of Things
- New technologies as a tool of rationalization
- Substitution Technologies / Disruptions
Ecological environment:
- Use of raw and auxiliary materials / recycling
- Sustainability / energy consumption
- Environmentally friendly operating processes
- Wastewater and exhaust air purification / heat recovery
Politics:
- Form of government / stability / legal certainty
- Foreign investment law / tax and depreciation law
- Transfer of capital / credit conditions
- Party political development / possibility of lobbyist influence
- Foreign policy development, conflicts, wars
- Increasing government intervention in the economy
Legal Development:
- Law changes / changes in regulatory competence
- Labour law / consumer protection
- Restrictions on competition
Demographic development:
- Population / population structure / age structure
- Number of households / consumers / size and structure of households (single and multi-person households)
- Level of education
- Urban / rural population
Social development:
- Leisure habits / change of values / consumption habits
- Safety conditions / risk tolerance
- Qualification level and educational development
- Social mobility
- Income distribution / structure of household expenditure
Customers:
- Market development / market share
- Target groups / market segments
- Distribution channels per product / product group / dealer and other customer intermediaries
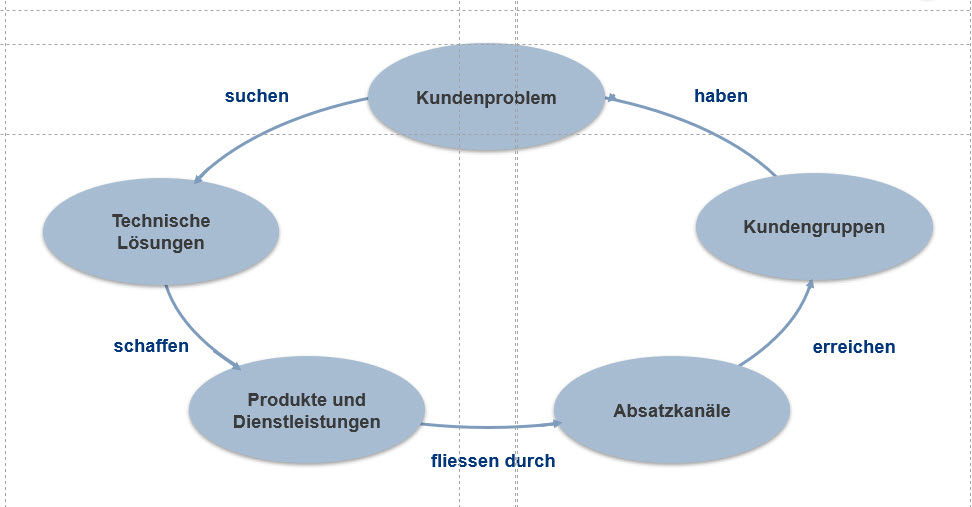
- Customer problems and needs (incl. solutions) and demand behavior
- Changes of value norms and settings of the customer
- Customer sensitivity regarding price and condition changes
Suppliers:
- Stocks and supply of essential products
- Inventories and supply of operating and auxiliary materials
- Options for the substitution of raw materials, consumables and auxiliary materials
- General developments in the procurement market
- Development of transport prices and costs of supply chain
- Dependency on suppliers
Employees:
- Recruitment costs and challenges / salary levels and trends
- Development of legal benefits
- Union activities and demands
- Reduction and flexibility of working hours
- Education and skilled workers
Investors:
- Sources of capital raised
- Rules on raising and transferring capital
- Foreign exchange rates and interest rates
Public institutions:
- Legislator
- Government authorities
- Local authorities
- Unions
Media / NGOs:
- Public agenda and interests – e.g. human rights / climate change
- Common interests
Competitors:
- Existing competitors (by product group / market segment)
- Potential new competitors – same industry / other industry
- Market entry barriers (norms, laws, etc.)
- Degree of rationalization / use of new technologies or goods
- Innovation capacity and flexibility
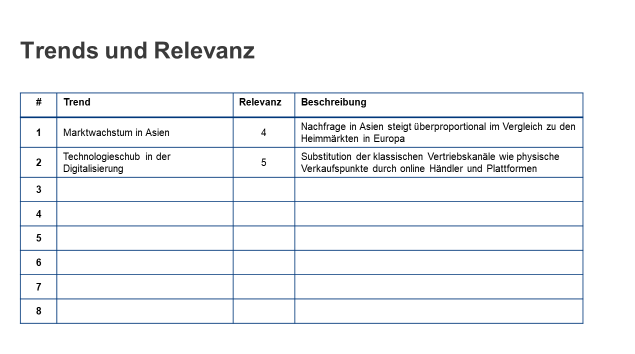
We select the trends from this list and evaluate them with relevance: How important is this trend for our company? A short description will help you later to understand exactly what is meant.
Notice::
The rule plus/minus seven also applies here. Limit yourself to one page, and if you write a little larger, it will be full with 10 trends. We want to limit ourselves to a number that is manageable and therefore controllable. The art of selection is to determine the essential trends that make up the majority of possible changes. It is a matter of selecting those influential variables which, from today’s perspective, are the significant drivers for the future development of the environments, markets, products, customers and suppliers.
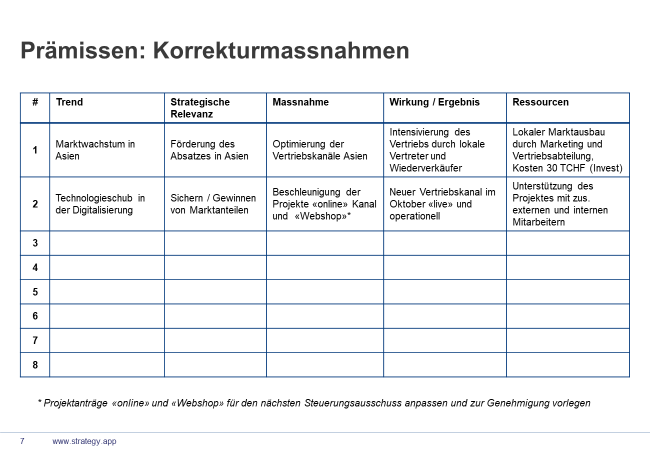
2. Measurands and assumptions
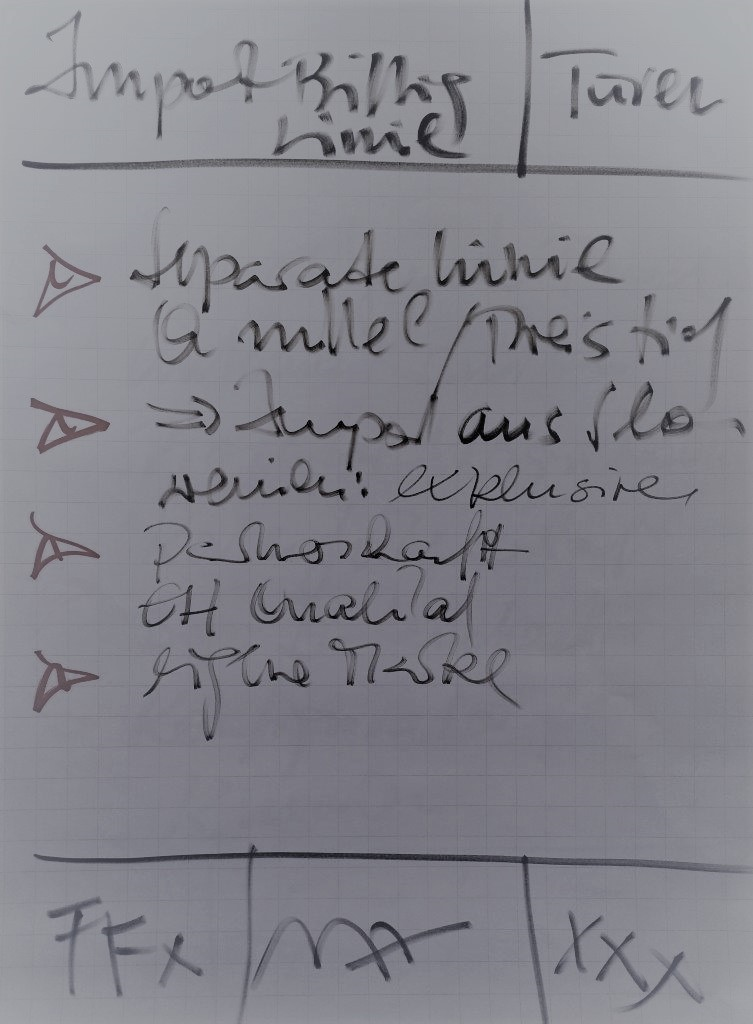
Now we form the assumptions and define the measurement parameters – how to measure or assess – and provide them with assumptions for the planning period. The time horizon here is three to five years, sometimes even less, depending on the industry or assumption. An example from one of our projects looks like this:
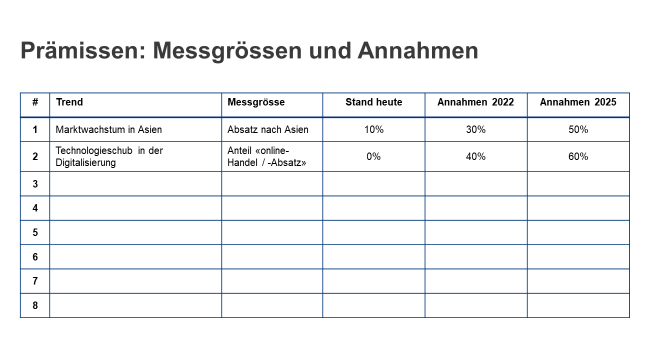
Figure 3: Determine measured variables and make assumptions
3. Precision, method and instrument for controlling
We prepare the controlling by refining the templates and describing the procedure. We will give you a few hints, which you can fill in and define as required.
Data collection
- We will collect the data – who is responsible
- What are the data sources and how should the data format be
- How often are the data collected?
Data analysis
- Describes «what happens if the expected values are not met» – does it concern the whole company or only one business area?
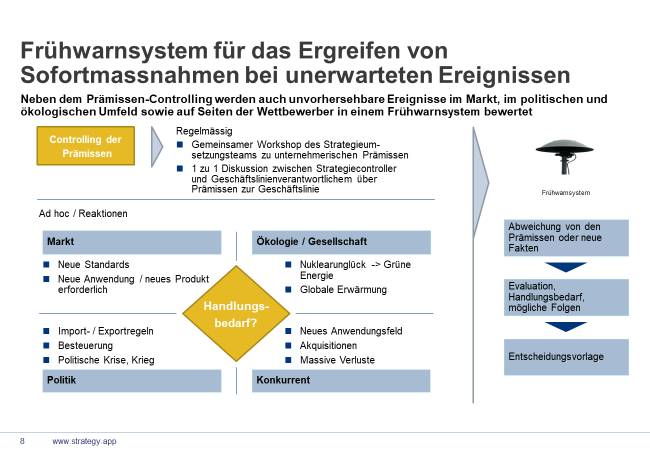
4. Controlling of assumptions / early warning system
The current status of all assumptions is recorded periodically and evaluated with regard to the strategy. The system also checks whether new or other external factors or events affect strategy implementation.
This raises questions such as:
- Did the economic data develop as expected?
- Has the technological development for substitution gone so far that the new basic technologies can be used?
- Are the conditions for market entry in China still good?
- Are customer behavior and demand for the new service developing according to the assumptions made in the strategy process?
- How far is the main competitor with innovative product development? Are we still one step ahead?
From assumption controlling to early warning system
It may well be that certain assumptions have been out of date since the last adoption of the strategy, or that new conditions have emerged that are relevant to the strategy’s implementation.
The 360° radar serves to keep a comprehensive eye on developments around the company, but also within it. The process responsibility for this task lies with the corporate development or the department that we call strategic planning. To ensure that all relevant facts are recorded and taken into account, however, the entire company must be involved. This can be done, for example, by systematically requesting or delivering market-related information from the sales department. A monthly feedback round serves as an instrument to keep the flow of information from the market going. For example, a company holds an open telephone conference every Monday. Sales staff can share their news for one hour. The procedure is organized in such a way that everyone joins in when and as soon as they can. There is no agenda and no discussion. Information is passed on as in an informal coffee break. After some time, this has meant that employees are eager not to miss this «meeting» because it is here that the most important news is exchanged.
Strategically relevant information is systematically collected and tracked in order to make any necessary adjustments or initiate measures.
Systematic market, competitor and customer research is part of this process. In addition, technological topics and news from the field of innovation management can be included.
The capture, filtering and exploitation of the information is then the responsibility of the strategy planning department. For events that require immediate response, the early warning system is turned on (see below); further facts are recorded and incorporated into the strategic review meeting.
5. Development of corrective measures
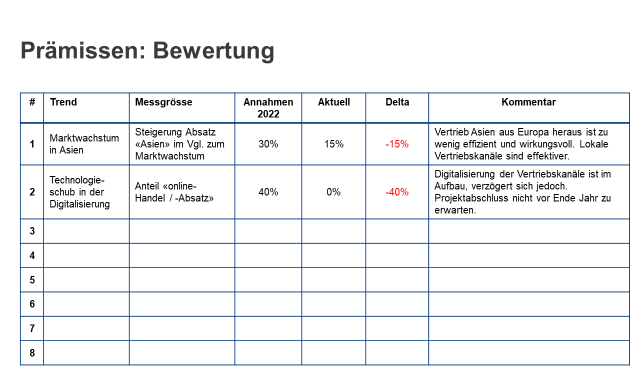
If deviations relevant to the strategy have been identified, the effects on the strategy must be assessed and the need for action evaluated. The same applies to new influencing factors which have been identified and analyzed in these assessment and evaluation steps.
The deviation is documented for each premise and the new influencing factors requiring action are evaluated and proposals for corrective measures are developed.
This work is carried out periodically, e.g. every three months or once a year. This ensures that strategy implementation is always based on relevant assumptions and that new influencing variables are identified in good time.
Basic remark
The growing complexity and uncertainty of market and industry developments presents strategic controlling with new challenges. Focusing on a detailed situation analysis and high-level preview methods is only one part of the work. So-called future scenarios are not used to illustrate what will be, but, what could be. The aim is not to predict a future as accurately as possible, but to form the scenarios that are decisive for the implementation of the strategy with the targeted recognition of external drivers and influencing variables. Using new scenario techniques, excellent early warning systems can be developed and introduced in a targeted manner. In addition, managers and employees are sensitized to important trends and external influences and thus to perform an additional «sensory» function for environmental changes.
We have prepared a Power-Point template for you to download here:
[popup_anything id=»1113″]Whitepaper Marketplace
Out of the box or outside the box
We use the marketplace at the very beginning of the design phase for the development of strategic options – in a mostly full-day workshop involving the entire team, which is best complemented by additional employees from the company.
To start with, ideas are collected on cards, usually only by keywords (the classic card sticking that you all know). At the end, we have concrete options that are not only written on a flipchart but have been approved by several participants. Discussions help to capture the ideas in the minds of employees and thus become a common good.
The procedure is fun, gives the participants a lot of freedom and brings the best ideas of the organization first onto paper and then into the minds of the participants.
Ingredients
For the marketplace to live properly, at least 12 people should attend. But it can also be up to 30.
-
Room: To do this, we take a room large enough for people to move around, group together and discuss. As a rule of thumb: Number of participants times two in m2.
The one wall is kept free to place cards – either directly on the wall or on bulletin boards. Each participant will write about 5 – 10 cards. All other walls are kept free for described flipchart sheets. - Pinboards and Flipcharts: Then we’ll provide flipcharts, about one per three participants. If the group consists of 20 people, we provide 6 or 7 flipcharts. On each flipchart are about 15 – 20 sheets prepared so that they can be filled directly.
- As preparation, we will create a description of the current activities on a morphological box . Alternatively, the eBMC can also be used (extended Business Model Canvas). This description is hung up or distributed as a big expression.
- What else do we need: Cards – about 10 per participant. The color may or may not be used consciously. Pens for each participant complete the ingredients.
Procedure
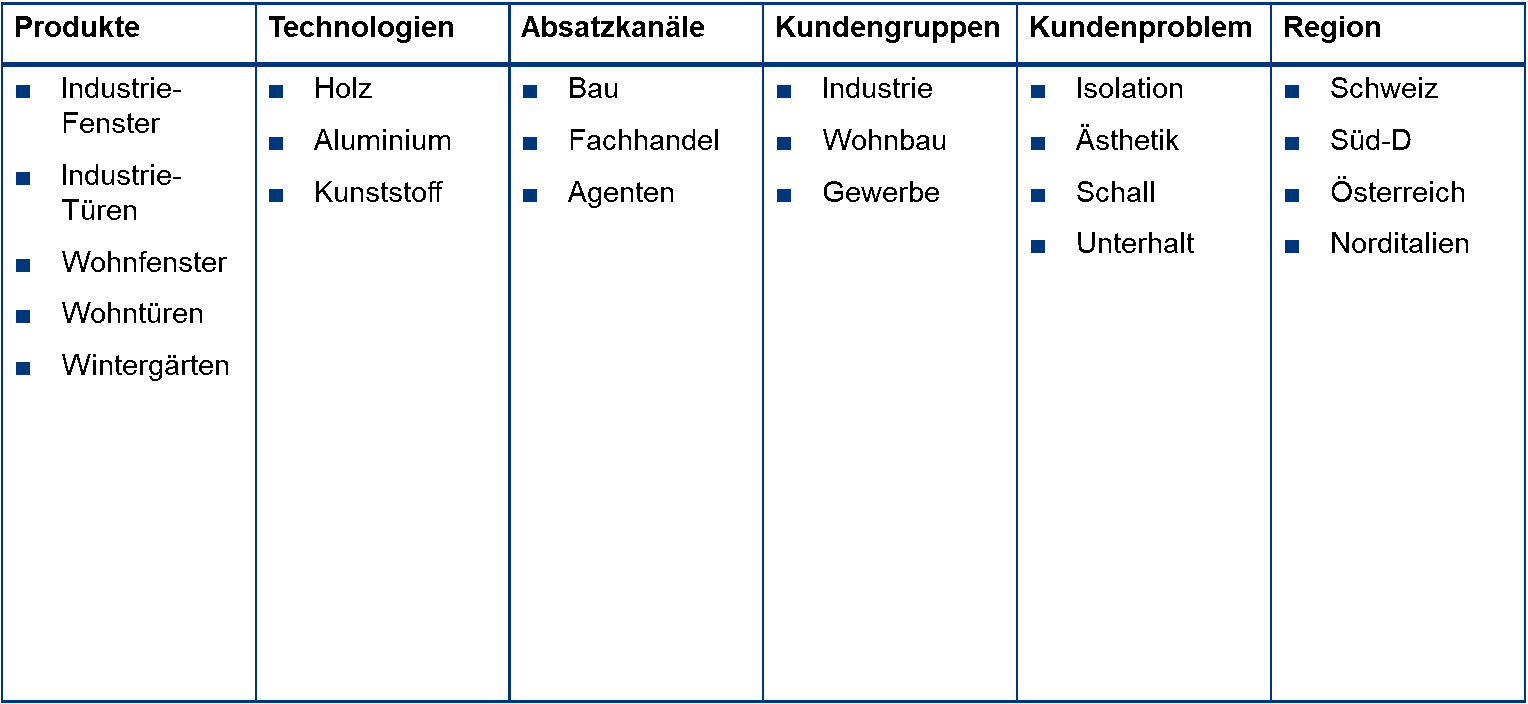
As an introduction, we again specify the characteristics of our company. A suggestion for the dimensions are:
- Marktes
- Products
- Technologies
- Customer needs
- Customers and customer groups
- Sales Channels
Optionally, we list the existing characteristics and already have their first ideas:
Then we systematically search for new ideas in every dimension. You can assign the participants to the dimensions. So that one group is looking for new technologies, the next for new markets and the third for new sales channels.

To do this, we’ll go through the following steps:
Step 1
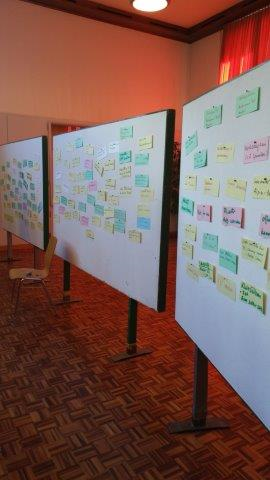
Ideas and options are written by the participants on cards and attached to bulletin boards or directly to a large wall. The cards are mixed and presented in disorder:
Step 2:
The participants briefly present their ideas and explain the background of each card.
Step 3:

To make enouch spade in the room – all the tables are pushed against the wall, and the marketplace is set up. For each 3 – 4 team members a flipchart is set up. For a team of 15 members, 3 – 5 flipcharts are placed in the room. On each flipchart are about 15 – 20 sheets prepared so that they can be filled directly. These flipcharts are now the stalls on the marketplace where ideas are sold, as follows:
Step 4:
Each member of the team has the task to concretize his ideas on a flipchart, to discuss with colleagues and to explain them. This can be ideas that it has captured on the cards, but also new ones that have emerged from the presentation of others. The brainstorming cards are not taken away but remain in their place. The reason is that the same cards can continue to be input for new ideas. Now the author sells his idea to his colleagues and tries to convince them. These testify with their signature, i.e. the currency in this marketplace are the signatures – and of course the ideas are sold. Ideas or proposals that do not convince at least three colleagues are eliminated.
Step 5:
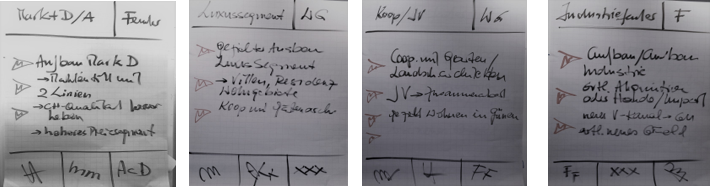
As soon as an idea or option has received the signatures of at least 3 people, any further discussion will be stopped. This is the task of the moderator. He removes the flipchart and attaches it in turn to the designated space on the wall of the room. We recommend to number them immediately.
Step 6:
The options listed on the flipcharts are presented by the «owners» and explained again.
Step 7:
The options thus compiled and discussed are now bundled, i.e. if there are overlaps or duplicates, then we put these together.
The next step is to capture, describe, and evaluate these options:

For the evaluation of these ideas or options, we use the instrument Adjacencies.
With STRATEY.APP these options are now captured and then further elaborated.
Collect and evaluate the strategic options in STRATEGY.APP
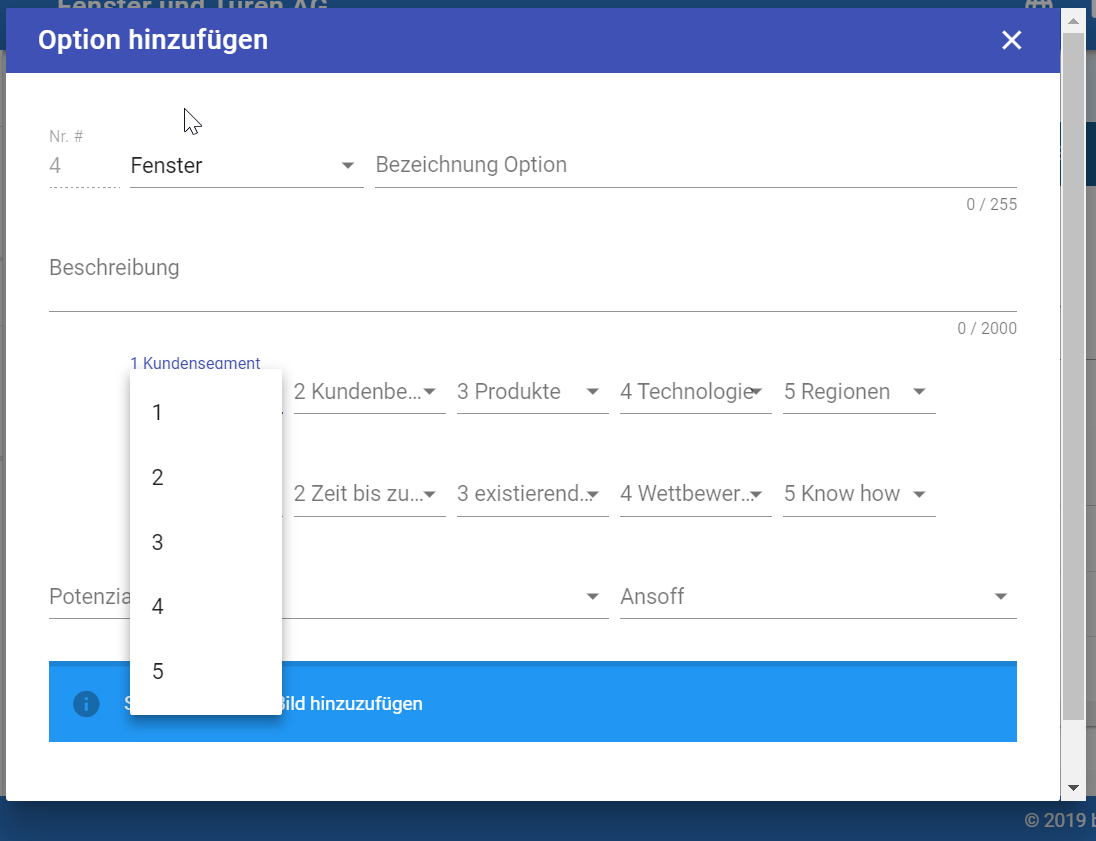
We record all options in the program and evaluate them according to the two dimensions
- Distance to the core business and
- Distance to success
As a result we get a list of options that are assigned to the respective business units.
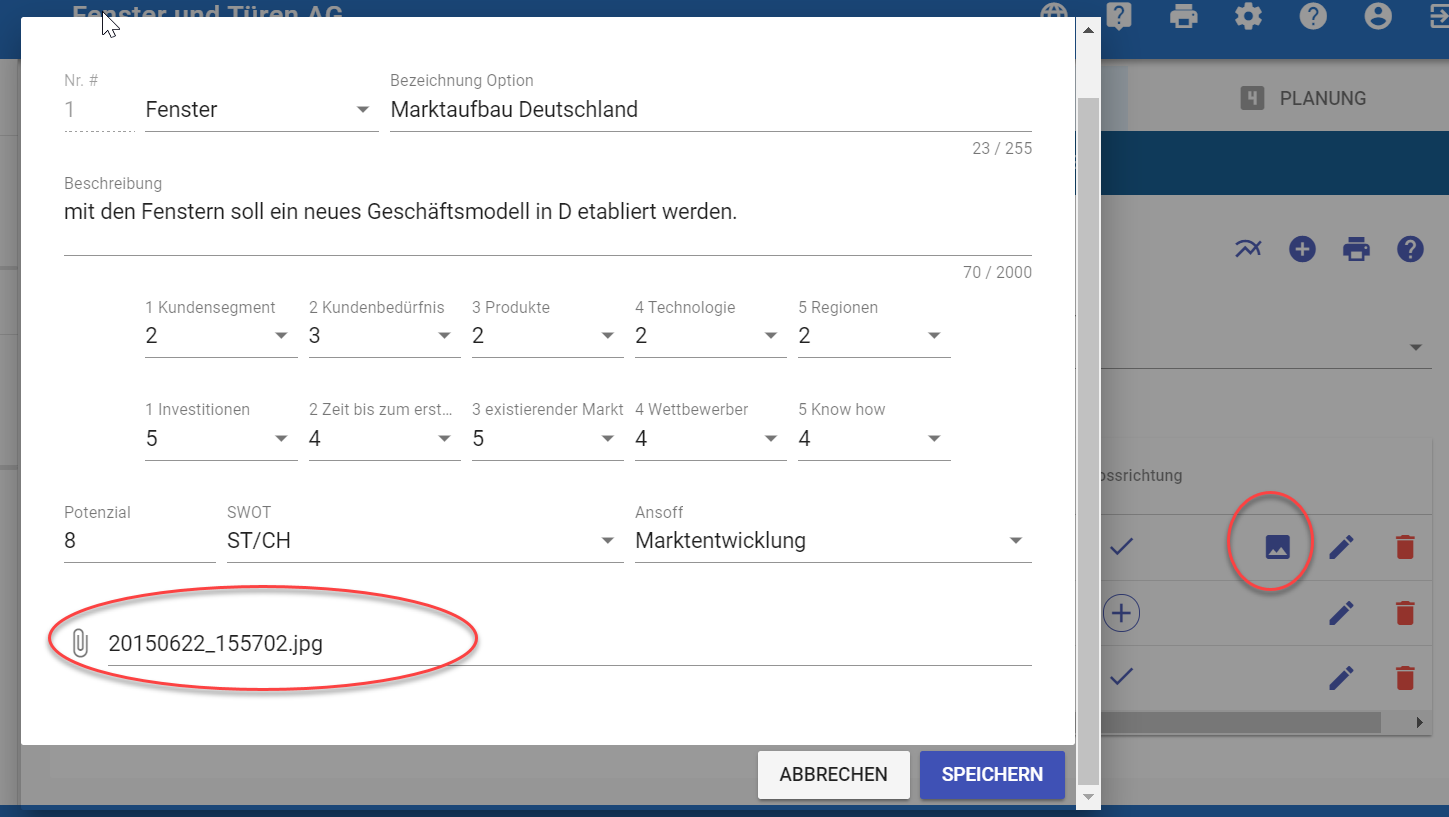
In addition, we have the opportunity to load the flip charts into the program. With that we can see the origin at any time.
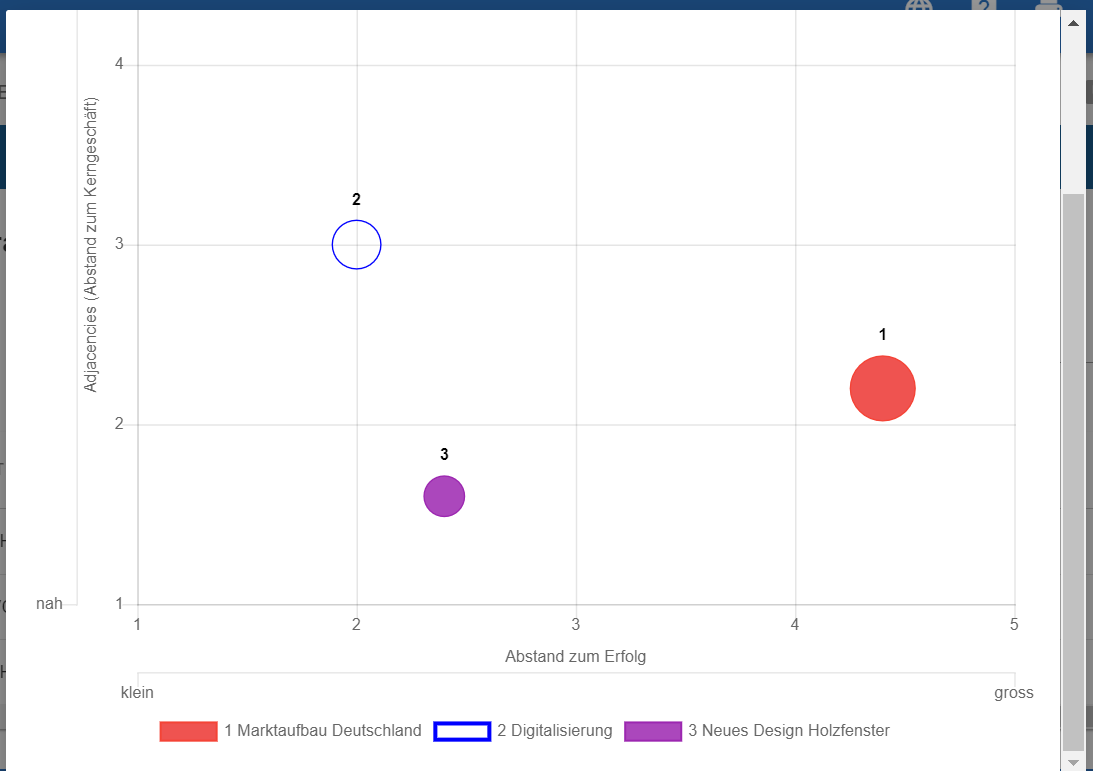
The Adjacency chart now tells us where each option comes from. From this we can select the strategic directions and then initiate the next steps.
See our whitepaper adjacencies