
Use Case: Strategieentwicklung mit KI – Regel 1: Struktur
Einleitung: Warum eine Struktur für den KI-Einsatz entscheidend ist
Künstliche Intelligenz (KI) eröffnet spannende Möglichkeiten in der Strategieentwicklung, doch dafür bedarf es eines klaren Rahmens. Struktur bildet das Fundament für den sinnvollen KI-Einsatz. Im ersten Blog unserer Serie haben wir die drei goldenen Regeln – Struktur, Fokus und Kontrolle – vorgestellt. Heute vertiefen wir Regel 1 für die KI in der Strategieentwicklung: Struktur. Die von der Strategy.app abgebildete Struktur macht den KI-Einsatz besonders effizient und gewinnbringend.
Drei Dimensionen einer strukturierten Strategieentwicklung
Dimension 1: Was ist Strategie?
Ein fundiertes Verständnis von Strategie ist essenziell, um die richtigen Grundlagen für den Einsatz von KI zu schaffen. Strategie befasst sich mit langfristigen Zielen und den Mitteln, diese zu erreichen. Dabei unterscheidet sie sich von Taktik, die konkrete Massnahmen zur Erreichung dieser Ziele umfasst. Strategie besteht typischerweise aus folgenden fünf Elementen:
- Leitbild: Umfasst Mission, Vision, Werte und übergeordnete Ziele.
- Strategische Fragen: Die Hauptherausforderungen, die sich aus der Diagnose ergeben.
- Strategische Stossrichtungen: Aufbauend auf den strategischen Fragen.
- Kohärente Massnahmen zur Umsetzung.
- Abgleich aller Elemente mit dem StrategyBoard.
Die Strategy.app unterstützt dabei, diese Elemente zu klären und zu strukturieren und bietet so eine ideale Basis zur Integration von KI. Weitere Details finden Sie unter Was ist eine Strategie?.
Dimension 2: Der Strategieentwicklungsprozess
Ein strukturierter Strategieentwicklungsprozess ist entscheidend, um KI effektiv zu integrieren. Basierend auf der Definition einer Strategie lässt sich dieser Prozess in fünf Phasen unterteilen:
- Diagnose: Eine umfassende Analyse, die in der Formulierung der strategischen Fragen mündet.
- Gestaltung: Entwicklung von Optionen und Stossrichtungen als zentrale Ergebnisse.
- Planung: Konzeption spezifischer Massnahmen, die anschliessend umgesetzt werden.
- Umsetzung: Die praktische Ausführung der geplanten Massnahmen.
Durch eine klare Abfolge dieser Phasen wird gewährleistet, dass der Einsatz von KI systematisch und strategisch ausgerichtet ist. Weitere Details zu den Phasen finden Sie unter Strategieprozesse.
Dimension 3: Vier Einsatzgebiete von KI in der Strategiearbeit
Schon jetzt zeigt sich, wie KI entlang einer strukturierten Strategieentwicklung optimal eingesetzt werden kann:
- Analyse / Diagnose: KI erleichtert tiefgehende Wettbewerbsanalysen
- Strategische Optionen entwickeln: KI hilft dabei, innovative Lösungen zu generieren.
- Berichte & Dokumentation: Die Erstellung von Berichten für Stakeholder wird durch KI effizienter.
- Bot oder Assistent für strategische Fragen: Ein KI-Assistent steht bereit, um gezielt Fragen zu beantworten.
Diese Einsatzgebiete werden wir im nächsten Blogartikel ausführlich beleuchten und ein paar praktische Beispiele vorstellen.
Fazit
Der gezielte Einsatz von KI in der Strategiearbeit erfordert eine klare Struktur als Fundament. Strategy.app bildet diese Regel 1 für die KI in der Strategieentwicklung: Struktur, präzise ab und schafft die ideale Umgebung für den erfolgreichen Einsatz von KI. Lassen Sie sich inspirieren und maximieren Sie den Nutzen von KI für Ihre strategische Arbeit.
Robuste und konsistente Strategien – update #05
Mit dem StrategyBoard zu einer robusten und konsistenten Unternehmensstrategie
In der schnelllebigen Geschäftswelt von heute ist eine robuste und konsistente Strategie essentiell. Viele Führungskräfte finden es herausfordernd, die Stärken, Schwächen, Chancen und Risiken ihres Unternehmens präzise zu erfassen. Darauf aufbauend eine stabile Strategie zu entwickeln, ist oft ebenso schwierig. Deshalb bieten wir Ihnen unseren Leitfaden „SWOT und StrategyBoard: Ihr Wegweiser für eine starke und klare Strategie“ an.
Warum ist dieser Leitfaden hilfreich?
Klarheit und Struktur: Der Leitfaden führt Sie durch den Planungsprozess. Von der ersten SWOT-Analyse bis hin zur Umsetzung der Strategie wird jeder Schritt einfach erklärt. So wird die strategische Planung greifbar und umsetzbar.
Praktische Werkzeuge: Neben Grundlagen enthält der Leitfaden praktische Tools und echte Beispiele. Sie zeigen, wie Strategien erfolgreich umgesetzt werden.
Flexibilität: Der Leitfaden hilft Ihnen, Ihre Strategie anzupassen, wenn sich Ihre Branche oder die Herausforderungen ändern.
Für wen ist dieser Leitfaden?
Der Leitfaden richtet sich an CEOs und Geschäftsführer von mittelständischen bis großen Unternehmen. Er ist für alle gedacht, die ihre strategischen Fähigkeiten verbessern und ihre Organisationen zum Erfolg führen wollen.
Zusammenfassung
„SWOT und StrategyBoard“ gibt Ihnen Einblick in bewährte Modelle und bietet eine Anleitung, mit der Sie Ihre Ziele erreichen können. Dieser Leitfaden ist der Schlüssel zu einer robusten und konsistenten Strategie. Er hilft Ihnen, sich in Ihrer Branche durchzusetzen.
Sind Sie bereit, Ihre Planung zu verbessern? Klicken Sie auf den Link, melden Sie sich an und laden Sie Ihren Leitfaden herunter. Starten Sie heute mit der Entwicklung einer stärkeren Strategie!
Nutzen Sie die Chance, Ihre strategischen Fähigkeiten zu verbessern. Melden Sie sich jetzt an und beginnen Sie mit der Transformation und Umsetzung Ihrer Strategie!
Laden Sie Ihren Leitfaden heute noch herunter!
update #01 – Kundennutzen
In unserem neuesten update# konzentrieren wir uns auf den Kundennutzen. Dieses Thema ist entscheidend für die Zufriedenheit der Kunden und den Erfolg Ihres Unternehmens. Es ist wichtig, den Wert zu verstehen, den Kunden aus Ihren Angeboten ziehen, und diesen auch messbar zu machen.
Was bedeutet Kundennutzen?
Kundennutzen zeigt den Wert, den Ihre Produkte oder Dienste für die Kunden haben. Er kann in der Lösung eines Problems oder im Erfüllen eines Wunsches liegen. Wenn Kunden einen hohen Nutzen erfahren, steigert das ihre Zufriedenheit und ihre Treue zu Ihrer Marke.
Wie kann man Kundennutzen messen?
Für das Messen ist die Kundennutzenanalyse ein wichtiges Werkzeug. Sie hilft uns, den Wert unserer Angebote in Zahlen auszudrücken. Durch Umfragen und Analysen verstehen wir besser, was Kunden schätzen und wie wir ihren Nutzen maximieren können.
Und wie fließt das in die Strategie ein?
Der Kundennutzen sollte die Grundlage Ihrer Strategiebildung sein. Es ist essentiell, die Bedürfnisse Ihrer Zielkunden genau zu kennen. Dann können Sie Angebote entwickeln, die diese Bedürfnisse auf besondere Art erfüllen. Die Ergebnisse aus der Kundennutzenanalyse nutzen Sie, um Ihre Produkte oder Dienstleistungen stetig zu verbessern.
Unsere Empfehlung
Wir laden Sie ein, unsere updates# herunterzuladen. Jeden Monat behandeln wir ein wichtiges Thema, das Ihnen hilft, Ihre Strategien zu verfeinern. Das aktuelle update# bietet praktische Einblicke in die Messung und Steigerung des Kundennutzens. Verbessern Sie Ihr Verständnis und Ihre Praktiken, indem Sie das update# jetzt herunterladen. Machen Sie den nächsten Schritt zur Verbesserung Ihrer strategischen Ausrichtung.
Whitepaper Adjacencies
The Adjacency method is based on a similar philosophy to the Ansoff matrix, but uses additional criteria. While the Ansoff matrix works with the dimensions product and market, the Adjacency method focuses on the dimensions distance to the core business and distance to success.
For the distance to the core business we take the two Ansoff criteria market and product and add the criteria technology, sales channel, regions, value chain (forward and backward integration) and applications.
For the dimension of distance to success, we work with criteria such as the level of necessary investment or duration until the first turnover.
Since the risk, and thus the probability of failure, increases with the distance to the existing business, the following rules apply:
- Develop new businesses in neighboring (adjacent) areas
- Do not develop new businesses in more than one dimension at the same time (for Ansoff, that would be diversification)
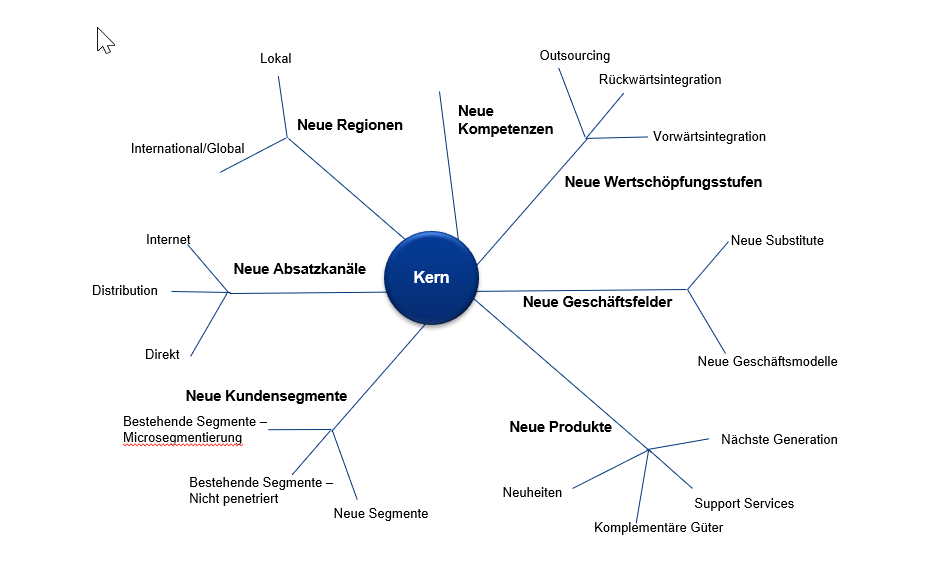
Figure 1: Expansion of the core business in multiple dimensions
The procedure is organized in the following steps:
- Definition of the core business
- Defining the criteria for the distance from the core business (Adjacency)
- Definition of criteria for the distance to success
- Development of strategic options (the marketplace method is suitable for this)
- Rating of adjacencies and distance to success for each strategic option
- Calculating the Adjacency Portfolio (see Excel Tool)
- Selection of options and development of strategic directions
Procedure:
1. Definition of the core business
In a first step, the core business is defined by the description of the business segments. You will find instructions on how to do this in the two whitepapers «Business Segment Structure» and «Business Segment Description».
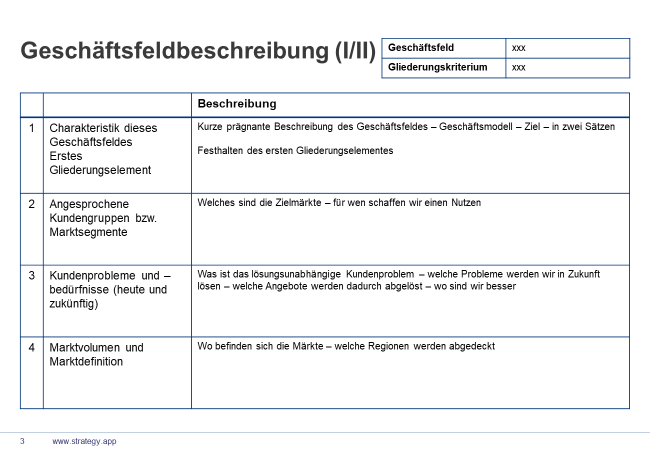
Figure 2: Business Field Description
2. Defining the criteria for the distance from the core business (Adjacency)
The criteria market / customer groups, products, technologies, sales channels and regions help us to measure the distance to our core business. If all are the same, we remain in our core business – the more of them are different, the further we move into new areas of business.
These criteria must be discussed, precisely defined and provided with a scale of values, e.g. with values from 1 to 3, which indicate the distance from the core business.
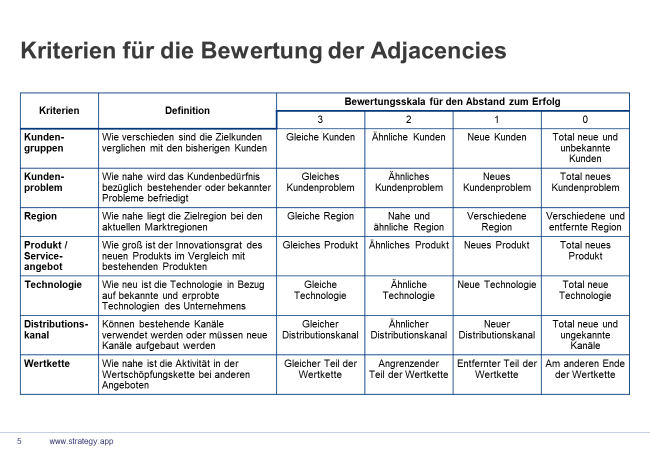
Figure 3: Definition of criteria for the dimension Adjacency
3. Definition of criteria for distance to success
Here we propose the following six criteria: Market size – Sales – Time to first sales – Competition – Substitution of existing products – Investments
These criteria should also be discussed, defined and provided with a scale of values, e.g. the expected market volume is evaluated with figures from 1 to 3.
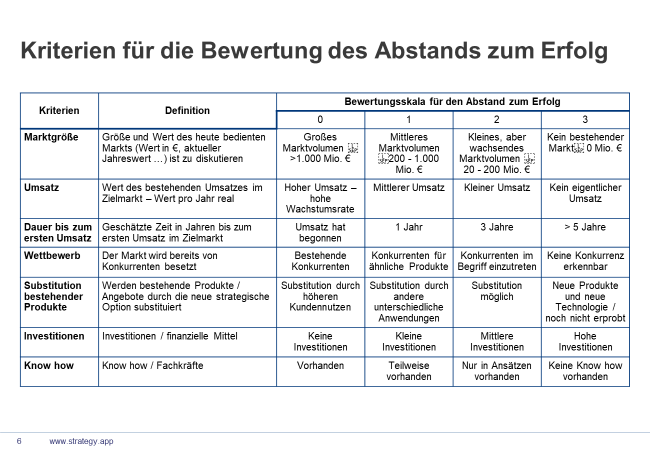
Figure 4: Description of the criteria for the distance to success
4. Developing Strategic Options
For the elaboration and compilation of strategic options and directions, we recommend the «Marketplace» method (we will also provide a whitepaper on this shortly). However, other methods can also be used here, such as brainstorming or systematic derivation from SWOT analysis. Or we can use simple forms to search for potentials in any direction (dimension).
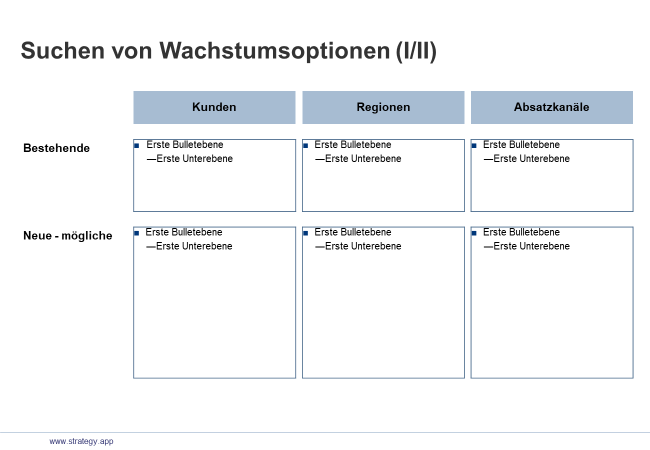
Figure 5: Developing strategic options
5. Assessment of adjacencies and distance to success for each strategic option
For each idea or option, the distance to the core business and the distance to success are evaluated based on the given criteria. A brief description of the discussion will help with later use or revision.
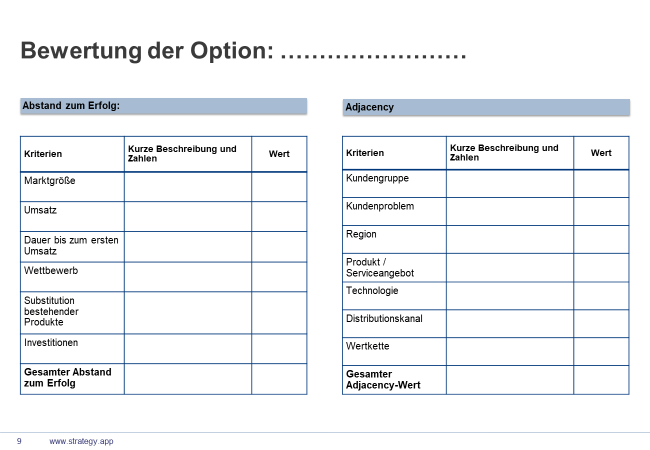
Figure 6: Assessment of the strategic options
6. Calculating the Adjacency Portfolio (see Excel Tool)
We provide you with an Excel tool for calculating the portfolio. The result shows at a glance the risk positions of the individual options, from the expansion of the core business to diversification which is totally different from the existing business.
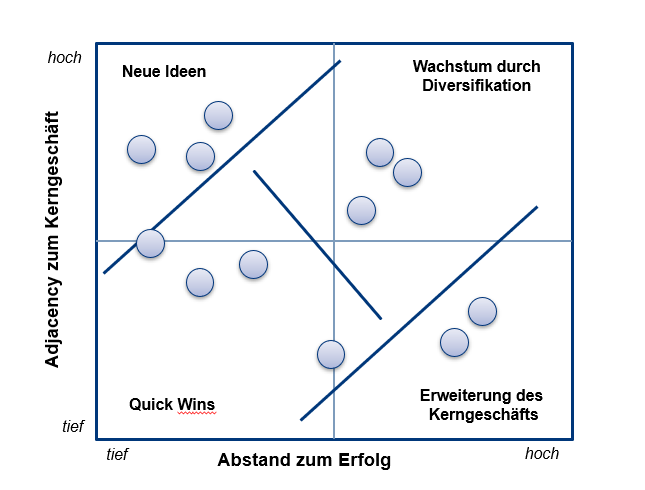
Figure 7: Rating of options (Excel tool or directly in STRATEGY.APP)
7. Selection of options and description of strategic directions
The risk portfolio can be used to divide up and prioritise the strategy directions.
The matrix can be roughly divided into 4 fields:
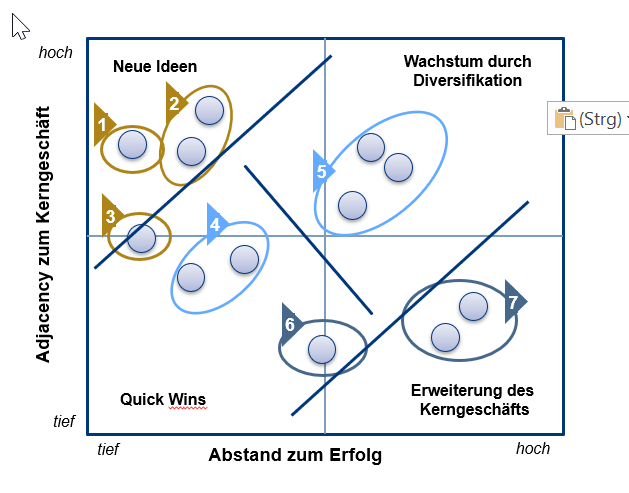
- Close to the core business and close to success (bottom left):
- These are the Quick-Wins. They can be implemented quickly and are in the core business. Often these are not big strategies, but rather immediate measures.
- Close to the core business, but big distance to success (bottom right):
- This is the strategic expansion of the core business. New, partly large and therefore strategic investments in the existing business. This includes, for example, the construction of a new factory.
- Far from the core business with a small distance to success (top left):
- These are often ideas for new business in the form of tests or pilot projects. Sometimes the effort is simply underestimated here. Nevertheless, it may be useful to launch targeted experiments or to try something without investing too much. This allows the risk to be kept under control.
- Far from the core business with a big distance to success (top right):
- This is real diversification. This not only involves a high risk, but also has a considerable cost. We recommend that you take another close look at these options and only tackle them after weighing up all the risks and arguments.
The preparation of a business plan and a risk assessment can now be built on this basis.
Assessment of strategic options with Adjacency in STRATEGY.APP
In STRATEGY.APP, the criteria for the Adjacencies tool are set in the parameters for the instruments:
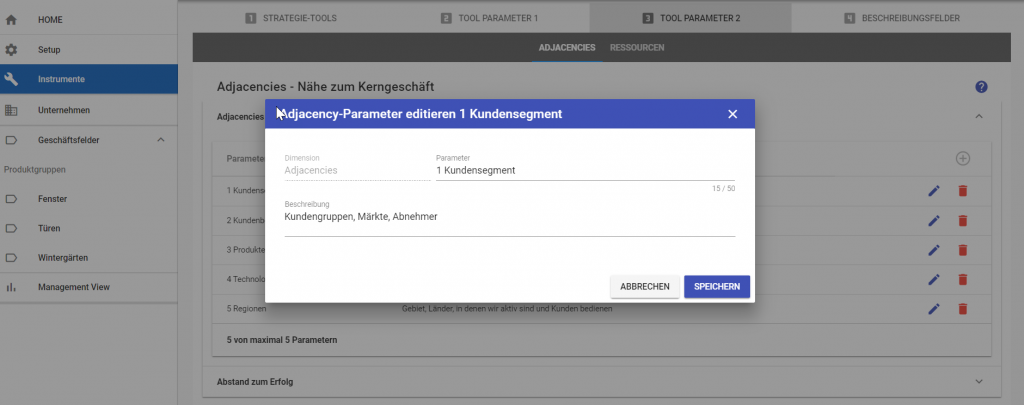
Figure 9: Input of the parameters for Adjacency
The strategic options that we have developed are therefore evaluated individually:
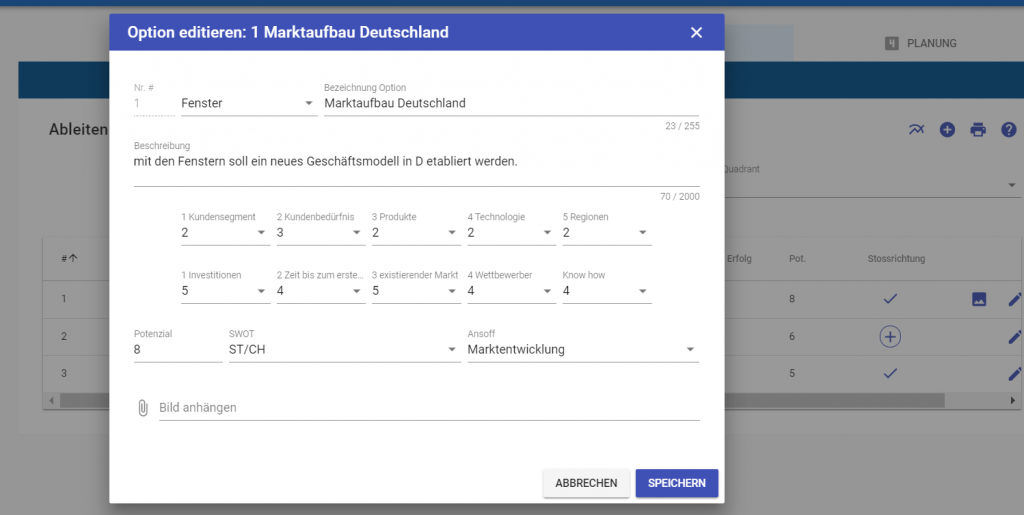
Figure 10: Rating of the individual options
The evaluation shows the position of the options on the adjacency matrix:
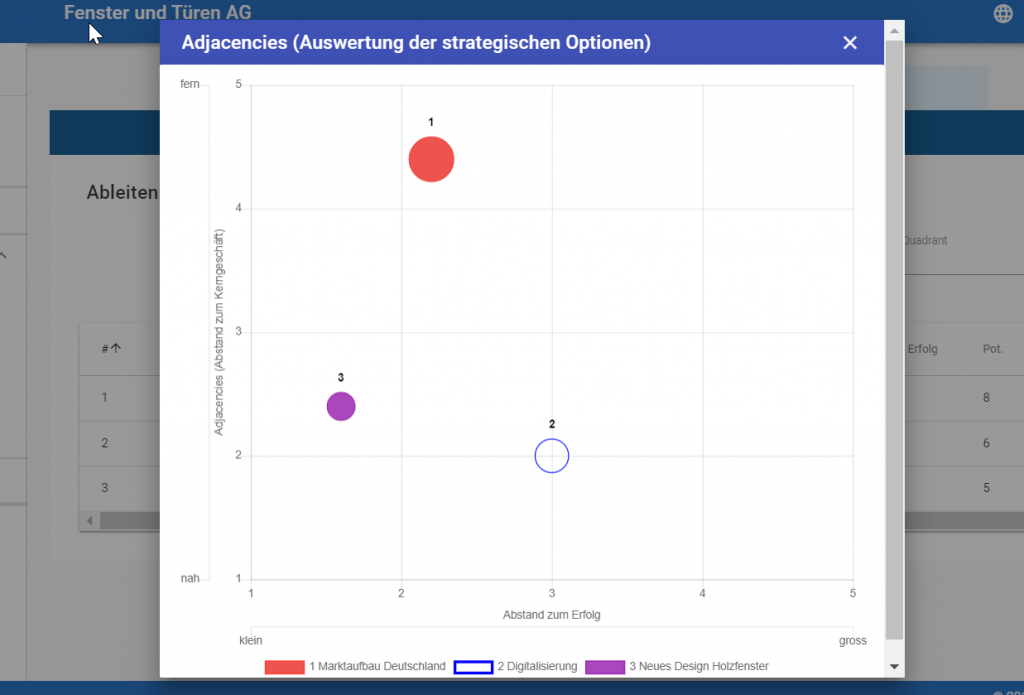
Figure 11: Position of the options on the adjacency matrix
Then the options for further processing are selected and described and quantified as strategic directions.
Note: Agility
Here is a note on the subject of agility: STRATEGY.APP allows new options to be added at any time, and new directions to be created from the options. On the other hand, running strategic directions can be stopped or reset at any time. The business plan and the measures are then automatically adjusted or removed. This makes it possible to react to changes in the environment at any time.
We have prepared a practical tool (xls) and a template for PowerPoint for you to download:
Download Adjacenciy example (xlsx)
Download Adjacency PPT Template
Whitepaper Controlling of Assumptions
Controlling of Assumptions
In each strategy definition, assumptions are made on which the development of the strategy is based. Such an assumption may be technological advances such as the digitization. Others are a certain customer behavior towards increasing service demand, economic activity or certain expectations regarding market growth.
The Tasks of assumption controlling are:
Assumption controlling implements a early warning system that detects possible deviations in order to counteract in time.
- The early recognition of external developments that deviate from the assumptions or premises
- Impact Assessment for both qualitative (eg paradigm shift in customer behavior leads to shifts in demand on distribution channels) and quantitative (impact on target revenue, cost items and market shares)
- Introduce corrective action to adapt the strategy to new circumstances
Creating an assumption controlling:
1. Working out the assumptions
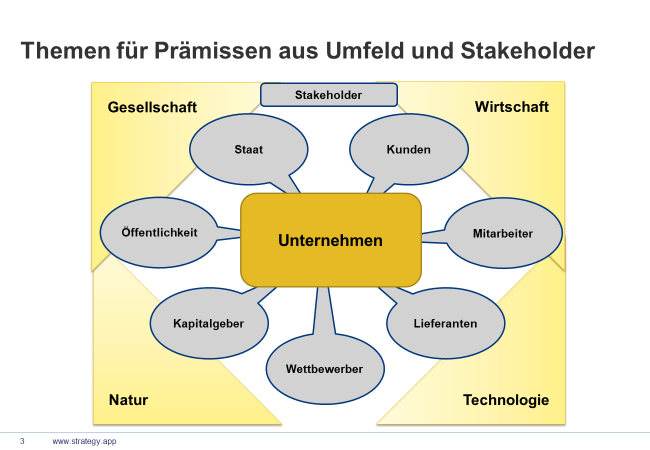
First, we compile those assumptions / premises that play a role in the future development of the company. We assign these premises as follows:
- Environment:
- Society, nature, technology and economy
- Stakeholders:
- Customers, employees, suppliers, investors, competition, public, goverment
We have put together a list of topics. It is the same list from which we also compile the main trends for the SWOT:
Economic environment:
- Global development / economic development of individual regions or national economies
- Fluctuations in international currencies and interest / inflation rates Rise / decrease of country-specific risks
- Customs duties and tariffs / International trade barriers
- Economic integration, e.g. Eurozone
Technological developments
- Development of key technologies
- Digitization / Internet of Things
- New technologies as a tool of rationalization
- Substitution Technologies / Disruptions
Ecological environment:
- Use of raw and auxiliary materials / recycling
- Sustainability / energy consumption
- Environmentally friendly operating processes
- Wastewater and exhaust air purification / heat recovery
Politics:
- Form of government / stability / legal certainty
- Foreign investment law / tax and depreciation law
- Transfer of capital / credit conditions
- Party political development / possibility of lobbyist influence
- Foreign policy development, conflicts, wars
- Increasing government intervention in the economy
Legal Development:
- Law changes / changes in regulatory competence
- Labour law / consumer protection
- Restrictions on competition
Demographic development:
- Population / population structure / age structure
- Number of households / consumers / size and structure of households (single and multi-person households)
- Level of education
- Urban / rural population
Social development:
- Leisure habits / change of values / consumption habits
- Safety conditions / risk tolerance
- Qualification level and educational development
- Social mobility
- Income distribution / structure of household expenditure
Customers:
- Market development / market share
- Target groups / market segments
- Distribution channels per product / product group / dealer and other customer intermediaries
- Customer problems and needs (incl. solutions) and demand behavior
- Changes of value norms and settings of the customer
- Customer sensitivity regarding price and condition changes
Suppliers:
- Stocks and supply of essential products
- Inventories and supply of operating and auxiliary materials
- Options for the substitution of raw materials, consumables and auxiliary materials
- General developments in the procurement market
- Development of transport prices and costs of supply chain
- Dependency on suppliers
Employees:
- Recruitment costs and challenges / salary levels and trends
- Development of legal benefits
- Union activities and demands
- Reduction and flexibility of working hours
- Education and skilled workers
Investors:
- Sources of capital raised
- Rules on raising and transferring capital
- Foreign exchange rates and interest rates
Public institutions:
- Legislator
- Government authorities
- Local authorities
- Unions
Media / NGOs:
- Public agenda and interests – e.g. human rights / climate change
- Common interests
Competitors:
- Existing competitors (by product group / market segment)
- Potential new competitors – same industry / other industry
- Market entry barriers (norms, laws, etc.)
- Degree of rationalization / use of new technologies or goods
- Innovation capacity and flexibility
We select the trends from this list and evaluate them with relevance: How important is this trend for our company? A short description will help you later to understand exactly what is meant.
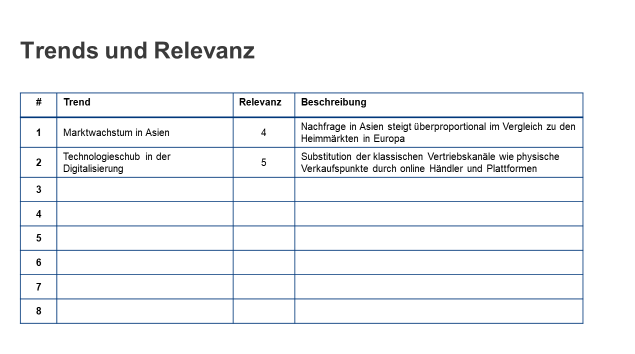
Notice::
The rule plus/minus seven also applies here. Limit yourself to one page, and if you write a little larger, it will be full with 10 trends. We want to limit ourselves to a number that is manageable and therefore controllable. The art of selection is to determine the essential trends that make up the majority of possible changes. It is a matter of selecting those influential variables which, from today’s perspective, are the significant drivers for the future development of the environments, markets, products, customers and suppliers.
2. Measurands and assumptions
Now we form the assumptions and define the measurement parameters – how to measure or assess – and provide them with assumptions for the planning period. The time horizon here is three to five years, sometimes even less, depending on the industry or assumption. An example from one of our projects looks like this:
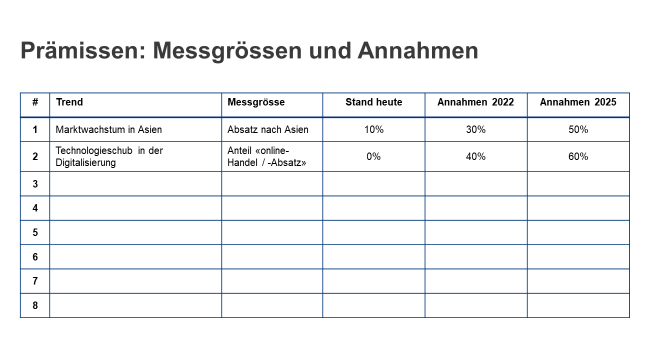
Figure 3: Determine measured variables and make assumptions
3. Precision, method and instrument for controlling
We prepare the controlling by refining the templates and describing the procedure. We will give you a few hints, which you can fill in and define as required.
Data collection
- We will collect the data – who is responsible
- What are the data sources and how should the data format be
- How often are the data collected?
Data analysis
- Describes «what happens if the expected values are not met» – does it concern the whole company or only one business area?
4. Controlling of assumptions / early warning system
The current status of all assumptions is recorded periodically and evaluated with regard to the strategy. The system also checks whether new or other external factors or events affect strategy implementation.
This raises questions such as:
- Did the economic data develop as expected?
- Has the technological development for substitution gone so far that the new basic technologies can be used?
- Are the conditions for market entry in China still good?
- Are customer behavior and demand for the new service developing according to the assumptions made in the strategy process?
- How far is the main competitor with innovative product development? Are we still one step ahead?
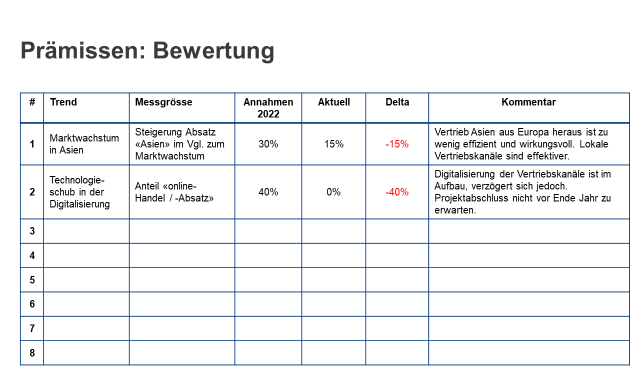
From assumption controlling to early warning system
It may well be that certain assumptions have been out of date since the last adoption of the strategy, or that new conditions have emerged that are relevant to the strategy’s implementation.
The 360° radar serves to keep a comprehensive eye on developments around the company, but also within it. The process responsibility for this task lies with the corporate development or the department that we call strategic planning. To ensure that all relevant facts are recorded and taken into account, however, the entire company must be involved. This can be done, for example, by systematically requesting or delivering market-related information from the sales department. A monthly feedback round serves as an instrument to keep the flow of information from the market going. For example, a company holds an open telephone conference every Monday. Sales staff can share their news for one hour. The procedure is organized in such a way that everyone joins in when and as soon as they can. There is no agenda and no discussion. Information is passed on as in an informal coffee break. After some time, this has meant that employees are eager not to miss this «meeting» because it is here that the most important news is exchanged.
Strategically relevant information is systematically collected and tracked in order to make any necessary adjustments or initiate measures.
Systematic market, competitor and customer research is part of this process. In addition, technological topics and news from the field of innovation management can be included.
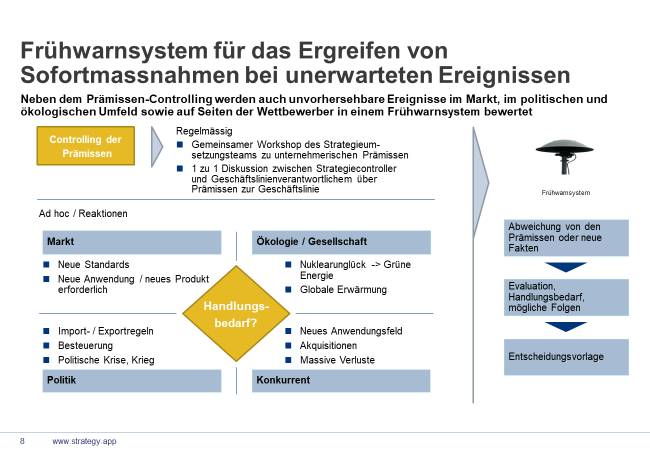
The capture, filtering and exploitation of the information is then the responsibility of the strategy planning department. For events that require immediate response, the early warning system is turned on (see below); further facts are recorded and incorporated into the strategic review meeting.
5. Development of corrective measures
If deviations relevant to the strategy have been identified, the effects on the strategy must be assessed and the need for action evaluated. The same applies to new influencing factors which have been identified and analyzed in these assessment and evaluation steps.
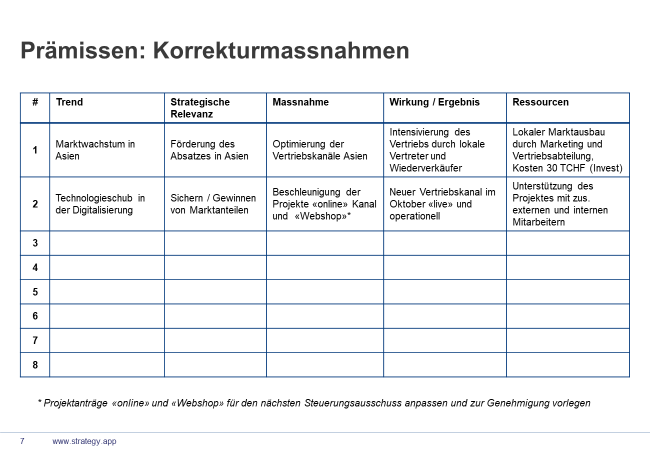
The deviation is documented for each premise and the new influencing factors requiring action are evaluated and proposals for corrective measures are developed.
This work is carried out periodically, e.g. every three months or once a year. This ensures that strategy implementation is always based on relevant assumptions and that new influencing variables are identified in good time.
Basic remark
The growing complexity and uncertainty of market and industry developments presents strategic controlling with new challenges. Focusing on a detailed situation analysis and high-level preview methods is only one part of the work. So-called future scenarios are not used to illustrate what will be, but, what could be. The aim is not to predict a future as accurately as possible, but to form the scenarios that are decisive for the implementation of the strategy with the targeted recognition of external drivers and influencing variables. Using new scenario techniques, excellent early warning systems can be developed and introduced in a targeted manner. In addition, managers and employees are sensitized to important trends and external influences and thus to perform an additional «sensory» function for environmental changes.
We have prepared a Power-Point template for you to download here:
[popup_anything id=»1113″]Take the future of your company into your own hands
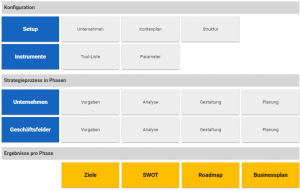
Developing, modifying and adapting business models, generating ideas, exchanging ideas, challenging digitization and experiencing disruptions together with your employees – with STRATEGY.APP you can take the future of your company into your own hands.
- STRATEGY.APP guides you step by step safely and clearly from the analysis of the initial situation through the design and planning to the formulation of the strategic measures.
- STRATEGY.APP creates a variety of quantitative reports with charts.
- STRATEGY.APP provides information about the current status of the measures at any time.
- The Management View gives you access to the key information: strategic directions, SWOT, sales and earnings goals, and measures – anytime, anywhere via tablet or smartphone.
- Any given time STRATEGY.APP will create a Strategy Report for you. Print out individual elements or a selection of the content you want.
The basic version of STRATEGY.APP is free and includes all features including printing to create a consistent business strategy. In addition you get the manual and the instructions online.
Download the manual for the program here:
https://www.strategy.app/wp-content/uploads/2019/03/StrategyApp_Handbuch_201903.pdf
Or start your strategy today and sign up for an access for your business: www.strategy.app
Whitepaper Marketplace
Out of the box or outside the box
We use the marketplace at the very beginning of the design phase for the development of strategic options – in a mostly full-day workshop involving the entire team, which is best complemented by additional employees from the company.
To start with, ideas are collected on cards, usually only by keywords (the classic card sticking that you all know). At the end, we have concrete options that are not only written on a flipchart but have been approved by several participants. Discussions help to capture the ideas in the minds of employees and thus become a common good.
The procedure is fun, gives the participants a lot of freedom and brings the best ideas of the organization first onto paper and then into the minds of the participants.
Ingredients
For the marketplace to live properly, at least 12 people should attend. But it can also be up to 30.
-
Room: To do this, we take a room large enough for people to move around, group together and discuss. As a rule of thumb: Number of participants times two in m2.
The one wall is kept free to place cards – either directly on the wall or on bulletin boards. Each participant will write about 5 – 10 cards. All other walls are kept free for described flipchart sheets. - Pinboards and Flipcharts: Then we’ll provide flipcharts, about one per three participants. If the group consists of 20 people, we provide 6 or 7 flipcharts. On each flipchart are about 15 – 20 sheets prepared so that they can be filled directly.
- As preparation, we will create a description of the current activities on a morphological box . Alternatively, the eBMC can also be used (extended Business Model Canvas). This description is hung up or distributed as a big expression.
- What else do we need: Cards – about 10 per participant. The color may or may not be used consciously. Pens for each participant complete the ingredients.
Procedure
As an introduction, we again specify the characteristics of our company. A suggestion for the dimensions are:
- Marktes
- Products
- Technologies
- Customer needs
- Customers and customer groups
- Sales Channels
Optionally, we list the existing characteristics and already have their first ideas:
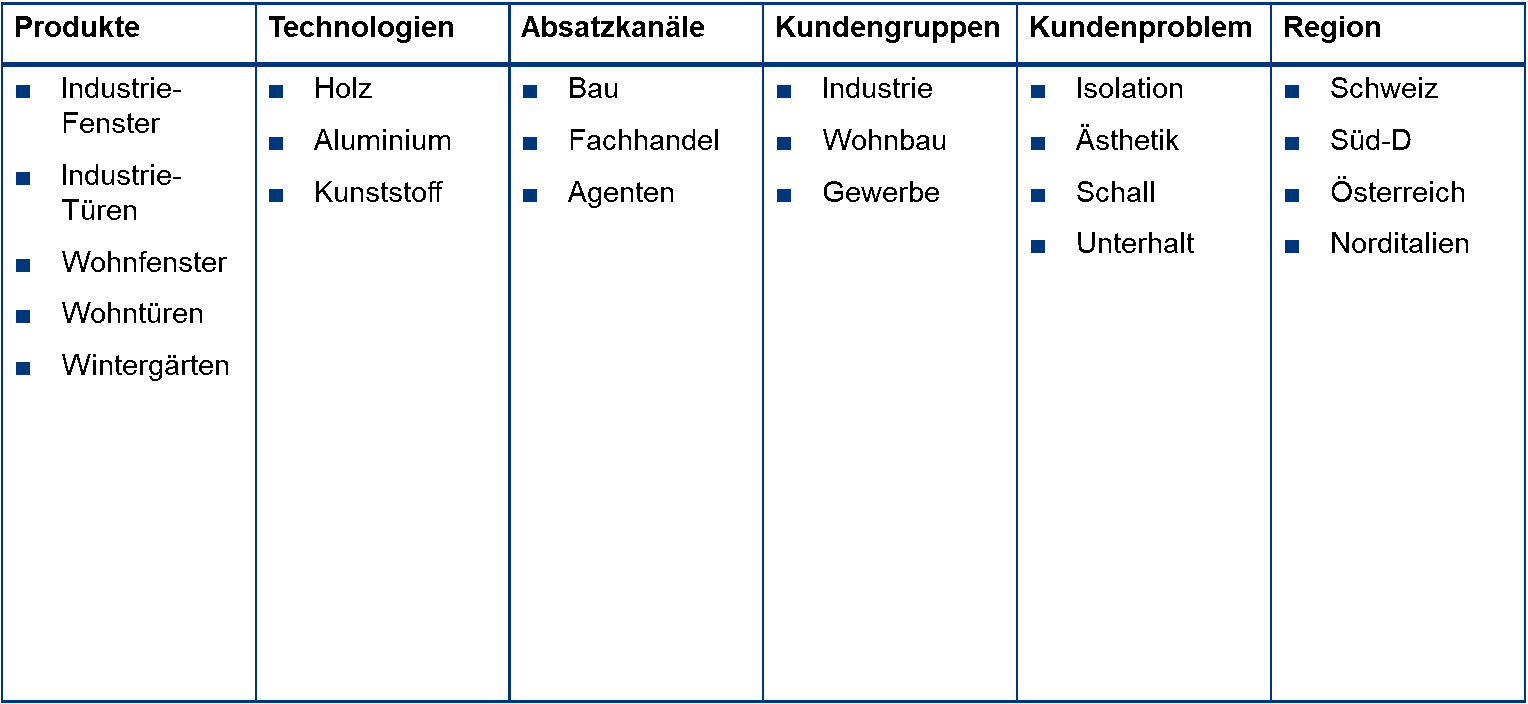
Then we systematically search for new ideas in every dimension. You can assign the participants to the dimensions. So that one group is looking for new technologies, the next for new markets and the third for new sales channels.

To do this, we’ll go through the following steps:
Step 1
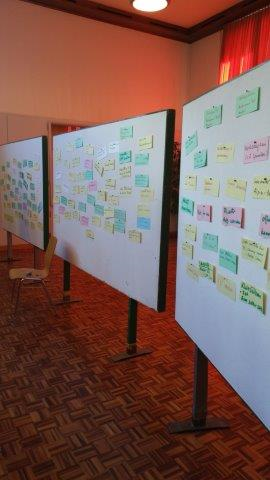
Ideas and options are written by the participants on cards and attached to bulletin boards or directly to a large wall. The cards are mixed and presented in disorder:
Step 2:
The participants briefly present their ideas and explain the background of each card.
Step 3:
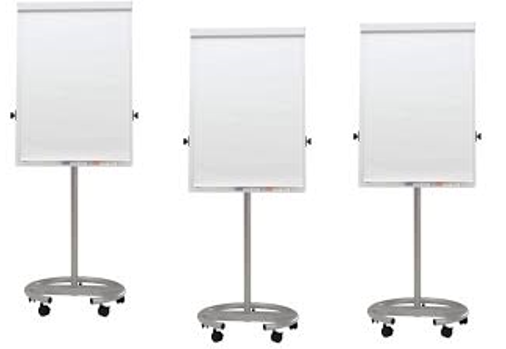
To make enouch spade in the room – all the tables are pushed against the wall, and the marketplace is set up. For each 3 – 4 team members a flipchart is set up. For a team of 15 members, 3 – 5 flipcharts are placed in the room. On each flipchart are about 15 – 20 sheets prepared so that they can be filled directly. These flipcharts are now the stalls on the marketplace where ideas are sold, as follows:
Step 4:
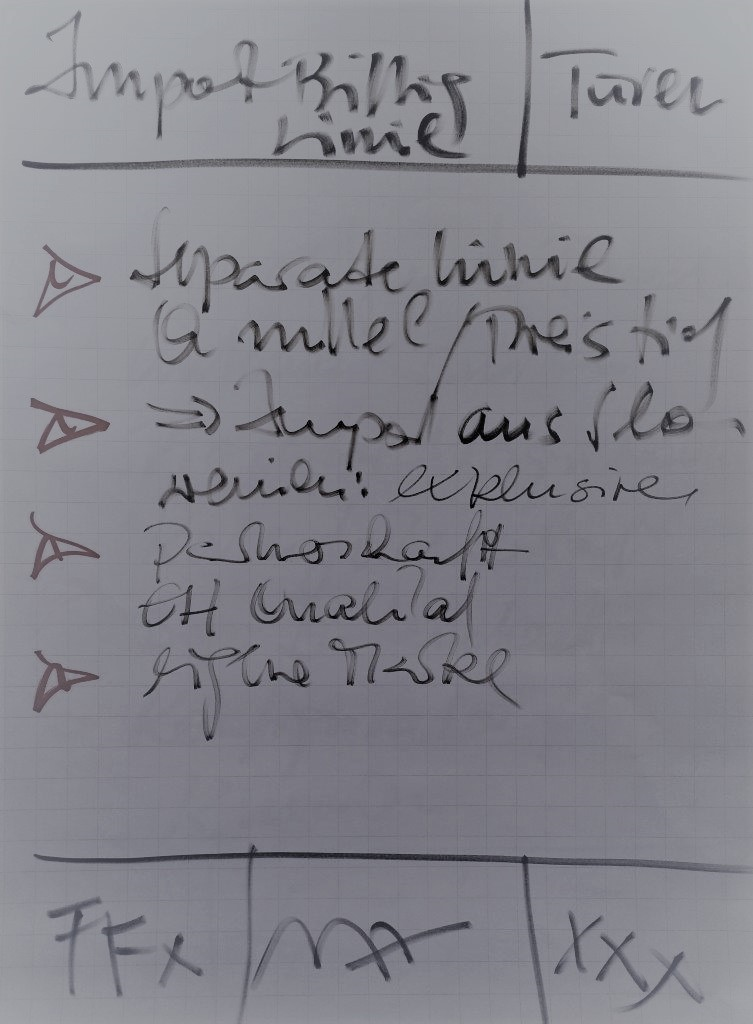
Each member of the team has the task to concretize his ideas on a flipchart, to discuss with colleagues and to explain them. This can be ideas that it has captured on the cards, but also new ones that have emerged from the presentation of others. The brainstorming cards are not taken away but remain in their place. The reason is that the same cards can continue to be input for new ideas. Now the author sells his idea to his colleagues and tries to convince them. These testify with their signature, i.e. the currency in this marketplace are the signatures – and of course the ideas are sold. Ideas or proposals that do not convince at least three colleagues are eliminated.
Step 5:
As soon as an idea or option has received the signatures of at least 3 people, any further discussion will be stopped. This is the task of the moderator. He removes the flipchart and attaches it in turn to the designated space on the wall of the room. We recommend to number them immediately.
Step 6:
The options listed on the flipcharts are presented by the «owners» and explained again.
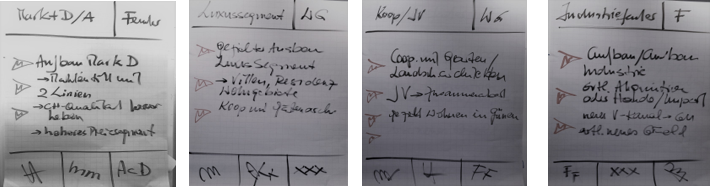
Step 7:
The options thus compiled and discussed are now bundled, i.e. if there are overlaps or duplicates, then we put these together.
The next step is to capture, describe, and evaluate these options:

For the evaluation of these ideas or options, we use the instrument Adjacencies.
With STRATEY.APP these options are now captured and then further elaborated.
Collect and evaluate the strategic options in STRATEGY.APP
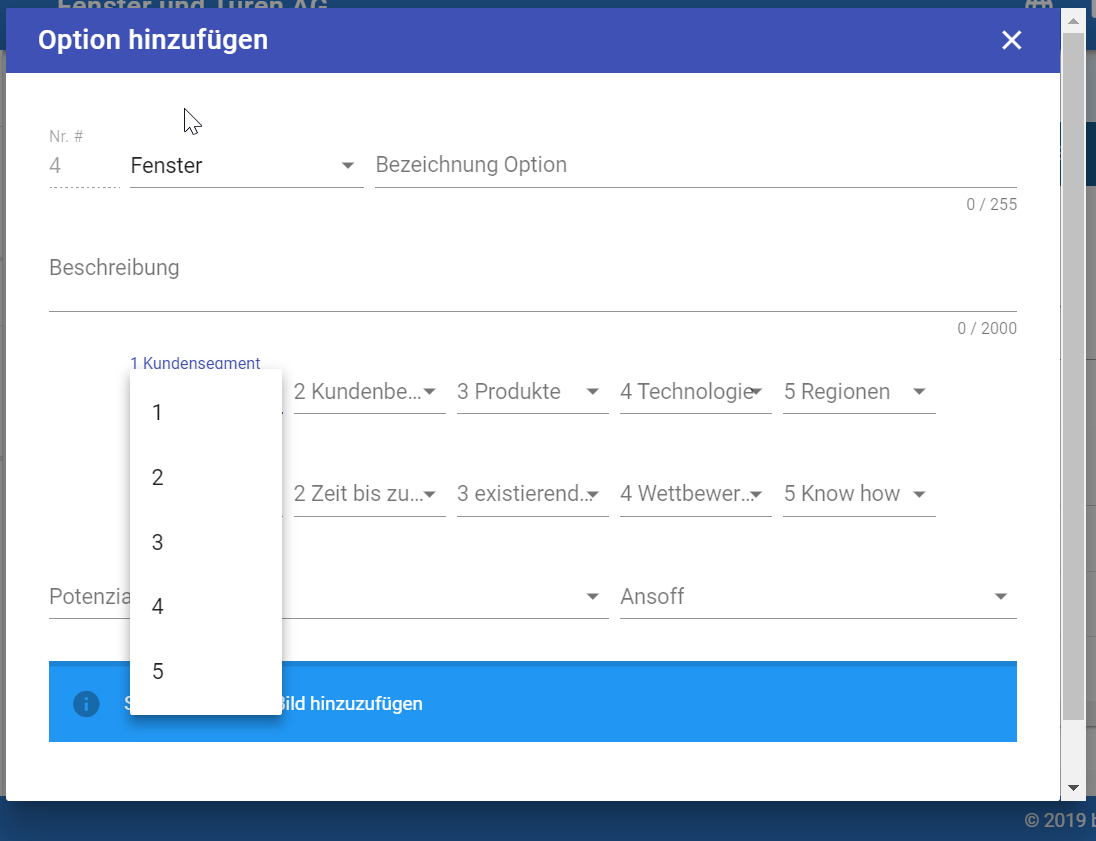
We record all options in the program and evaluate them according to the two dimensions
- Distance to the core business and
- Distance to success
As a result we get a list of options that are assigned to the respective business units.
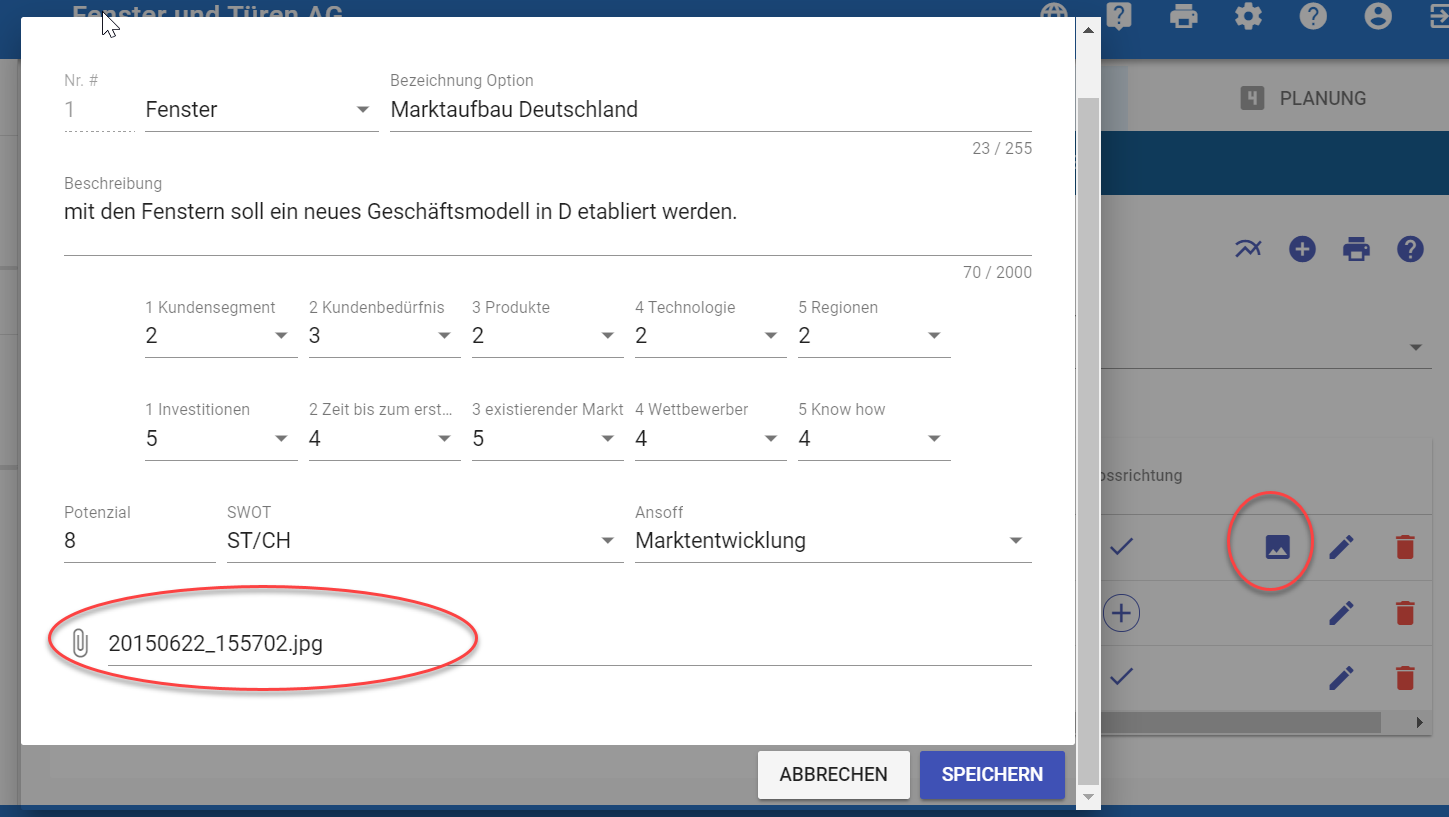
In addition, we have the opportunity to load the flip charts into the program. With that we can see the origin at any time.
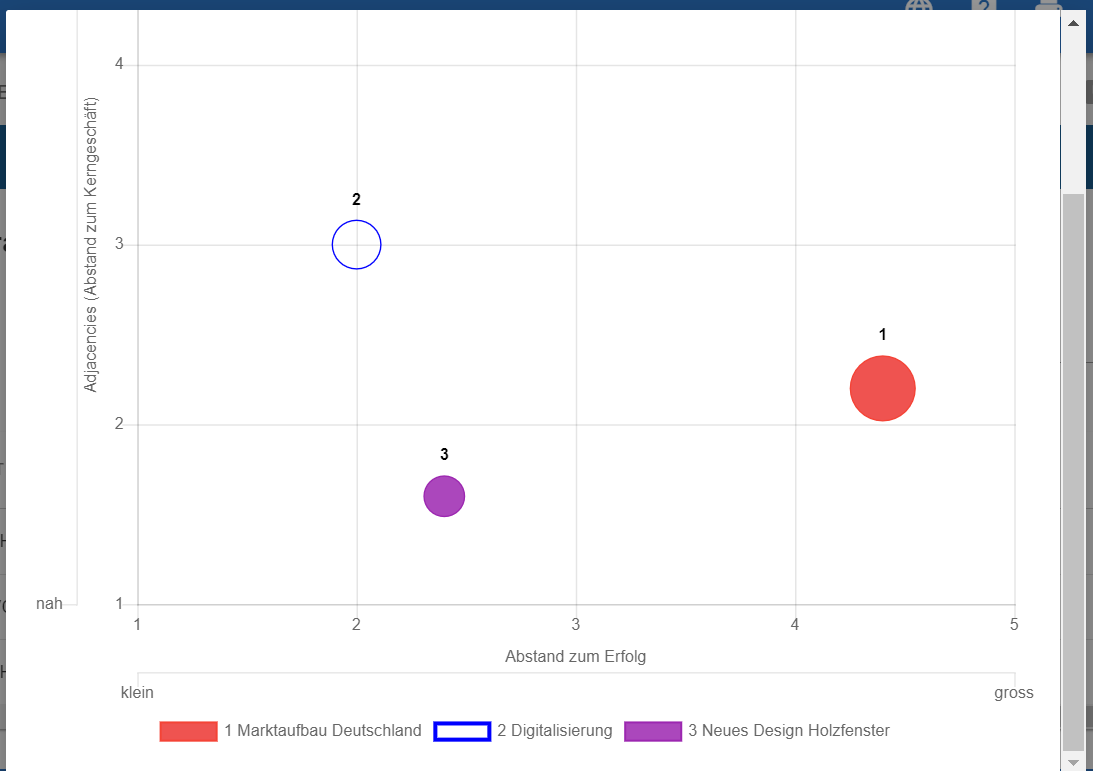
The Adjacency chart now tells us where each option comes from. From this we can select the strategic directions and then initiate the next steps.
See our whitepaper adjacencies
Do you have a strategy for your company?
4 x 4 questions about the status of your corporate strategy
Our strategy is 10% growth with 10% profit! That’s the answer I got from a CEO of a big Swiss company to the question of strategy.
When I went on to find out how this so-called strategy is anchored in the company, it turned out that most employees were unfamiliar with it. But it also lacked the essential building blocks that form the framework of a strategy and with which a strategy can be implemented and continuously developed and adapted.
Such building blocks include:
- clearly defined strategic units (business areas),
- strategic metrics and goals e.g. on market position, cost position, agility and innovativeness
- Implementation initiatives or projects with fixed roles and responsibilities
- a stand-alone business process of strategic planning,
- ongoing customization to keep your business agile
- and above all the involvement of the employees (see our 10 theses: Employees are the best strategists! ).

We have put together a small checklist of 4 x 4 questions for you to give you a first impression of the status your company’s strategy:
White Paper Innovation Management with the «Extended Business Model Canvas» (eBMC)
From the BMC to the eBMC
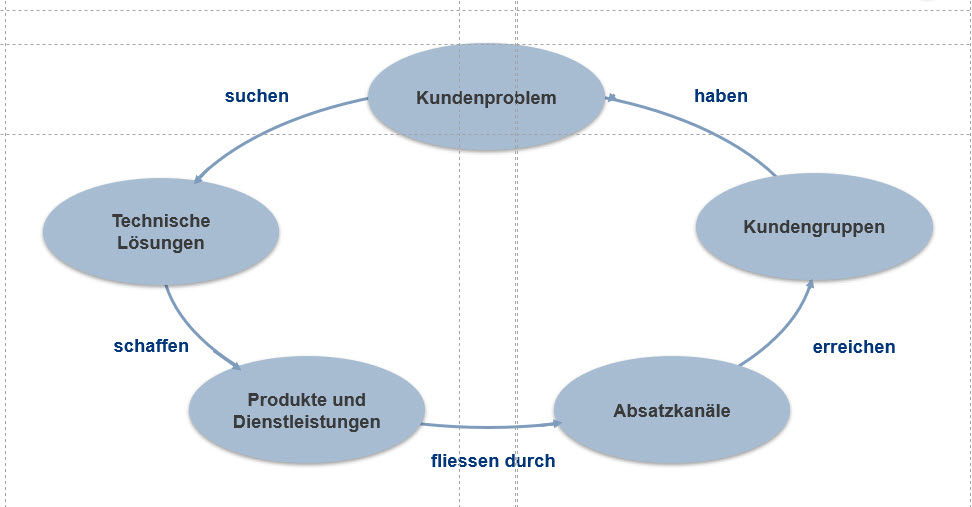
If you compare the Business Model Canvas with the navigation system of Aloys Gälweiler, you will see that the innovation is positioned there on the top level, with the two components «solution-independent customer problem» and «solution technology». We then put these two building blocks on the Business Model Canvas, making this extended Business Model Canvas (eBMC) a great tool for innovation management.
The book «Business Model Generation», published by Alexander Osterwalder, has hit the world of consulting and entrepreneurs like a bomb. The book is practical, very nicely done and above all very different from anything else in the field. And success proves the author right.
When a colleague told me about this model for the first time, something irritated me from the beginning – something was missing. It’s not like the BMC reinvented the world. Much can be found in it from known approaches and methods – or not.
What was lacking for me from the beginning is the building block «customer problem», namely the «solution-independent customer problem», as we used to call it. Based on the St. Gallen approach, we have always clearly separated the customer problem from the product or service itself.
The «Solution-Independent Customer Problem»
A watch is a product for the purpose of indicating the time. The customer problem, namely the time to know, however, is independent of the clock and can be solved differently. This applies even more clearly when the watch is offered as a luxury or status object. Then the customer problem is to make a difference, and that can be solved with completely different offerings or value propositions.
In the BMC, the customer problem is presented together with the building block product and then called «value offer» in New German. Later, a separate canvas was developed for the building block customer problem and with the help of the so-called empathy card (by Xplane).
I did not let this thought go, and I studied how the canvas model can be complemented with the customer problem without destroying the model’s logical unity and symmetry. And as is sometimes the case, the best thoughts come when you are alone: During a long run through the forest, I had the following idea: Let’s take the top level of the navigation system of Aloys Gaelweiler with the two components «solution-independent customer problem» and «solution technology,» and put them on the business model canvas. This makes this enhanced Business Model Canvas (eBMC) a great tool for innovation management.
This results in the following chain: customer – customer problem – technology – product or if you prefer: product – technology – customer problem – customer. The interesting thing is that the model remains nicely symmetrical and fits together logically.
Innovation Management with the eBMC
Supplemented with the two building blocks from Gälweiler’s navigation system, we use the canvas model mainly in the search for new businesses. This makes it an excellent instrument for innovation management. Because innovation can be driven forward from two sides: the market and the technology. Good practical instructions have been provided by Prof. Hugo Tschirky, who teaches at ETH Zurich, with his approach to innovation management. We find it in the book « Wunderwaffe Innovation «by Beat Birkenmeier and Harald Brodbeck. In the following, we will explain the two components «customer problem» and «solution technologies» in more detail so that you, too, can supplement the Business Model Canvas accordingly and use it as an innovation tool
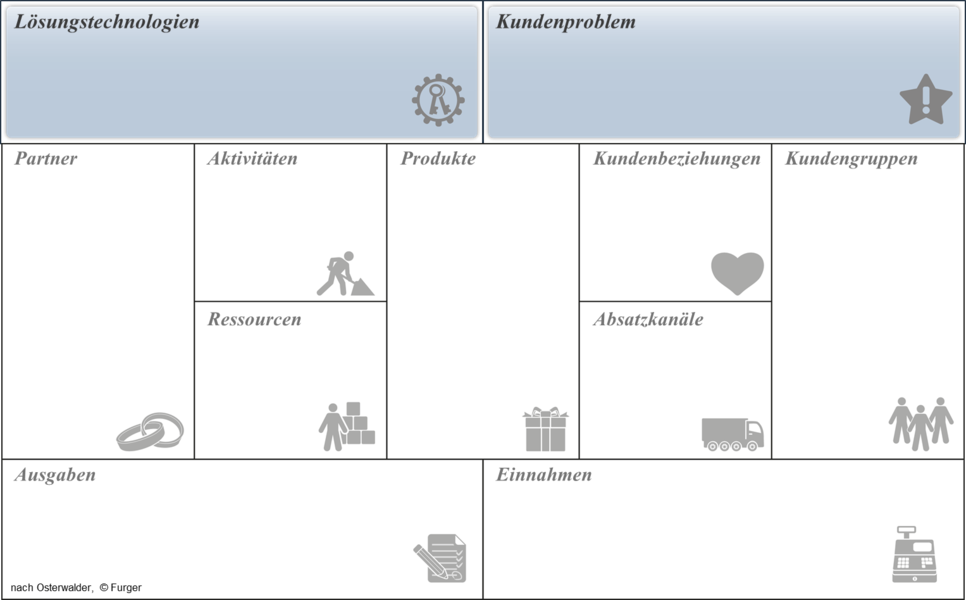
The module «customer problem»
This component stands for the customer problem that a company wants to solve – and that is about the «solution-independent customer problem». This means that this customer problem is often latent and is only solved differently and better by new products or services.
Here is an interim remark: We use the terms «customer problem» – «customer need» and «customer request» as synonyms. You are free to use your appropriate term here.
Solving a customer problem brings benefits to the customer, and it is for this benefit that the customer is ready to pay. So the product «car» is not primarily a beautifully designed machine on four wheels, but creates the ability to move from A to B at any time. It is often useful to abstract a business idea to this «problem» in order to come up with new solution techniques. Innovation, which is based on the market, is mainly concerned with it and can only work if you know the original customer problem exactly.
These may be a original problem as such like eating and drinking or secondary, derived problems such as luxury goods, holidays or other amenities that go beyond a basic elementary need.
The most important questions about this module:
- Which customer problem do we want to solve or which customer needs do we want to satisfy?
- What does the customer really pay for?
- What is the background of a problem solution?
- What are the real purchase criteria from the customer’s point of view?
- Which purchase criteria are better covered by our products?
- What brings the customer to put the money on our counter instead of the competition?
Instrument Customer Value Analysis (Value Proposition)
The customer value analysis is probably the didactically best instrument to focus the company in its activities on the customer benefit. The instrument can be set up directly on the building block customer problem. This creates the logical and substantial connection between customer benefit – products – customer groups.
On the basis of purchase criteria, a strategic Value Map is created that shows which competitors bring benefits to the customer with their products. For a detailed description, the tool itself, and the tutorial, see the white paper Customer Benefits on our BLOG
The module «Solution Technologies»
This component represents the technical solutions behind a product or service. Technologies usually have a specific lifecycle and, after a certain period of time, are replaced by new technologies that solve a customer problem better and more favorably. Thus, a substitution process begins, which leads to the replacement of existing products in the market. This process normally follows the pattern of an S-curve.
An example of this is the substitution of horse-drawn carriages by automobiles. Innovation always takes place in the interplay between the knowledge of the original customer problem and new solution technologies. The timeframe of substitution varies and can go on for years. The first presentation of a new solution concept is called invention, while innovation only exists when the product prevails in the market. Solution technologies can be incremental improvements or implement completely new concepts like the laser printer or the fax technology that has substituted the telex. Such completely new approaches often turn the existing business model upside down, which is described by the term «disruption».
The most important questions about this module:
- Which existing solution technologies are behind the products?
- In which phase of life are these technologies?
- Where are new inventions, and which customer problems can be resolved (much) better?
- Where and in which technologies does our company have competencies – a lead over the competition and therefore core competences?
- For which purchase criteria can we make significant improvements?
Instrument substitution analysis (S-Curve)
With the substitution analysis, the replacement of existing products or technologies by new offers can be shown.
This instrument helps on three levels:
- to find the optimal time to enter a new market (or exit)
- To set the growth rates in growing markets against the market and the competitor.
- To plan the transition to a price or cost market, and thus to exploit the cost position or to withdraw from the market.
eBMC in the STRATEGY.APP
For each business area, we create the eBMC with the current key elements. Each module is filled accordingly and can be adapted, printed or otherwise communicated at any time:
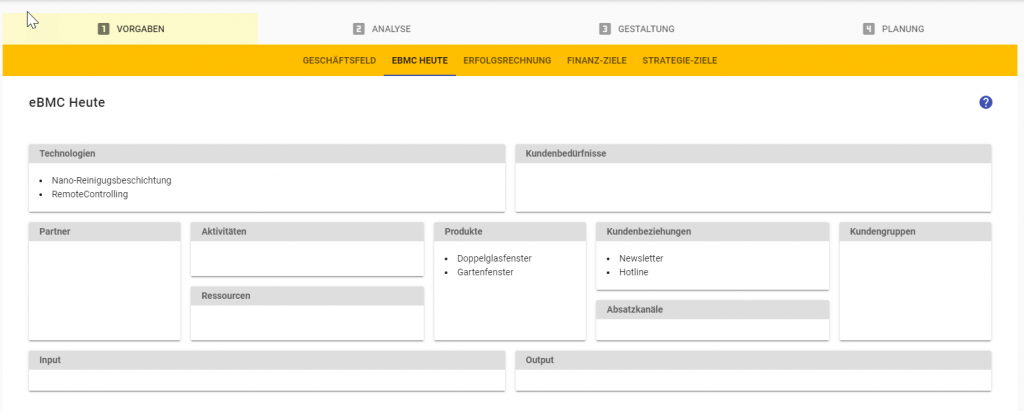
The individual blocks and elements are entered in the usual editing window:
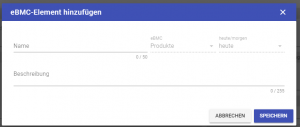
In the design phase, we can now add additional key elements; here e.g. as a new technology, the «nanotechnology» applied to the coating of the glass; or a new sales channel with which customers will be served in the future:
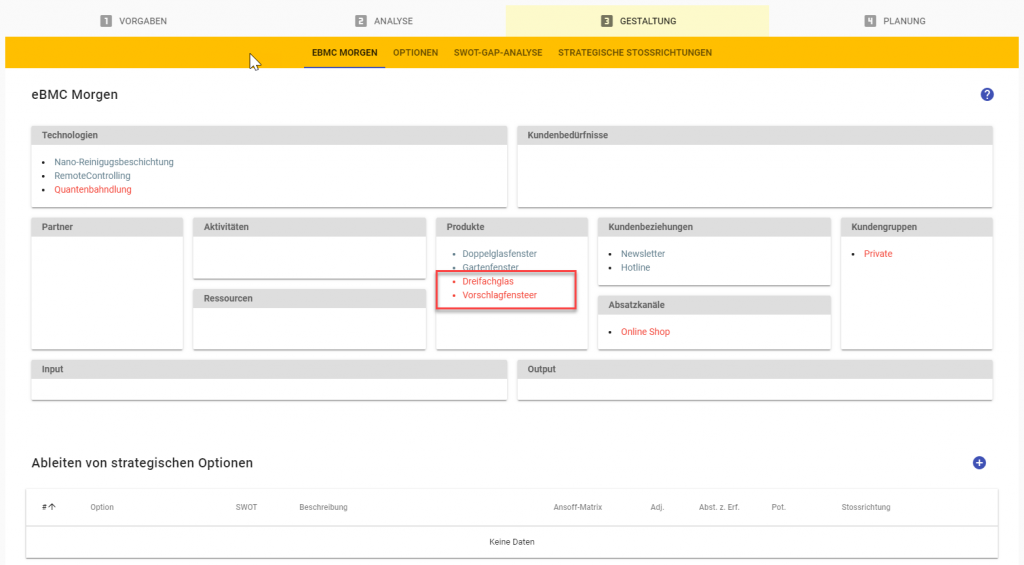
The new elements appear in red for identification. This provides us with a basis for deriving new strategic options and developing strategic directions and measures.
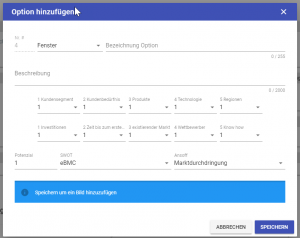
These are then listed in parallel with the options derived from the SWOT.
Here, too, options can be added, added, stopped or deleted at any time.
White Paper Competition Analysis
Download the Competitive Analysis (pptx) tool
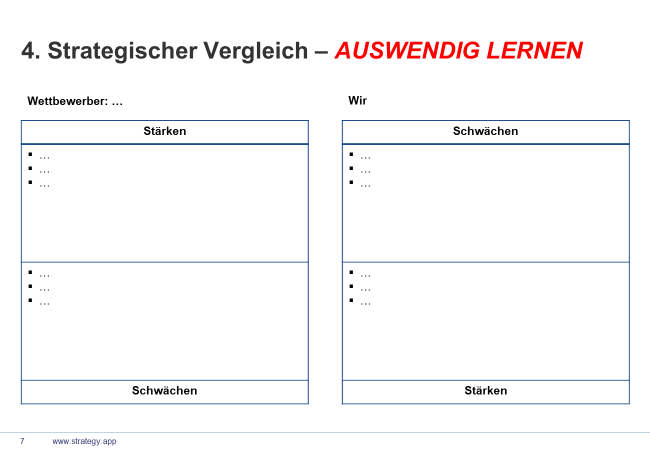
Competitive analysis shows our relative advantages over the competition. We compare the strengths of the competitor with our weaknesses and their weaknesses with our strengths. Every employee must be able to recite these benefits by heart at any time!
In the process described here, we first summarize the essential characteristics of a competitor into a profile. Then we create a profile of the strengths and weaknesses that every salesperson and every employee who deals with customers has to memorize.
Additional knowledge of competitors will provide additional tools such as the value proposition.
Note : I like to use the term competition – because competition comes from the Latin «concurrere» – to run together; and that’s about it.
Procedure
1. List of current and future main competitors
List all competitors that are strategically relevant to your business. We distinguish four groups:
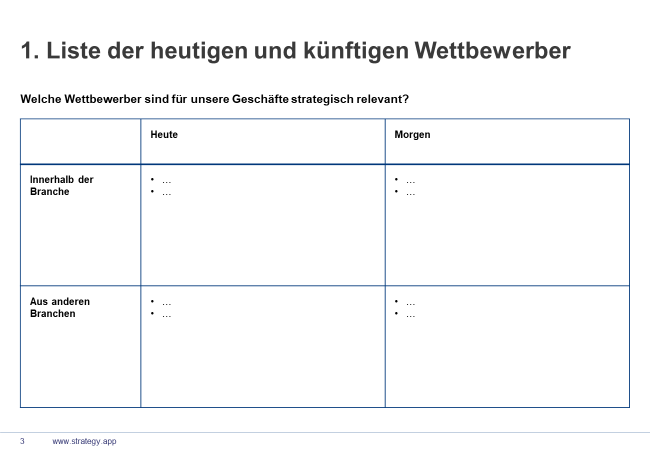
- Competitors today within the same industry
- Competitors tomorrow within the same industry – e.g. from other regions
- Competitor today from other industries
- Competitor tomorrow from other industries
The competitors from other industries are the most dangerous. For example, the «Enzyclopedia Britannica» by PC with the Encarta displaced – and that was very fast and none of the former typewriter manufacturer has considered the entry of PCs. The most dangerous competitors today for the automotive industry are not the other manufacturers, but new providers we Google, Apple or Uber.
2. Overview
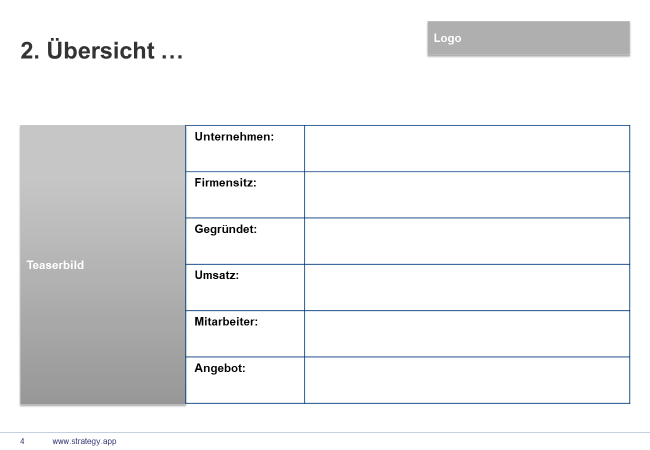
For each competitor, create an overview on a sheet by template (this is to be memorized):
3. Key data
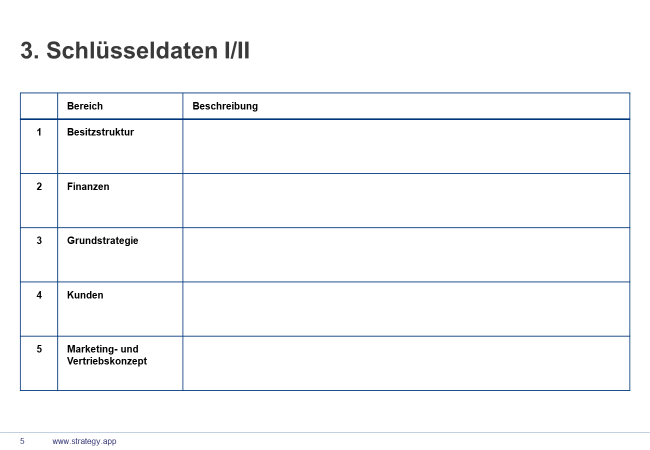
The key data is used to record the essential characteristics of the competitor. Do not write novels, but not just embroidery, but try to make one or two clear statements. Above all: do not just copy the details from the website of the competitor! First, these are mostly inaccurate and not very specific, and secondly, any learning effect is lost – and that’s a pity about your time.
We’ve listed a list of topics below so you can customize the template as needed.
4. Strategic Comparison
The strategic comparison presents the 3 main strengths and main weaknesses of the competitor against the 3 main weaknesses and main strengths of your company. Enter a maximum of 3 topics here and formulate them in such a way that they can be memorized by your employees. Ask them in between or distribute them on colored cards, which have space in the wallet.
5. The analysis topics
We have listed some topics for you in the template. You can supplement, adapt or replace these. The following list should give you some ideas or hints:
Ownership Structure
- Ownership structure of the company
- Capital structure, total market value and ownership
- Participations, major shareholders and other shareholder participations
- Legal form
Financials
- Sales, earnings in ROI, ROS and EBIT
- Order situation and order backlog
- Liquidity
Strategic key figures
- Market position and market share
- Cost position, efficiency, experience curve
- Quality position and customer value
Basic strategy
- Current situation and starting position
- Growth strategies, acquisition strategies, cooperation
- Regional strategies and regional presence
- Strategic alliances, acquisitions, JV, cooperations
Customers
- Main customers, main markets
- Sales by segments or by region
- References from major customers
Sales and marketing concept
- Sales organization
- Sales and distribution channels
- Marketing activities
- Brand strategy
Product and service portfolio
- Product lines, product range, brands
- Standards, certifications
- Service, repair, spare parts
Core competencies
- Core competence areas today and tomorrow
- Special products, services
- Processes (supply chain, sourcing concepts)
Production and production concept
- Organization of locations, processes
- Integration strategy – vertically / horizontally
- Strategy of the logistics organization, delivery times
- Local production (production location, products)
- Production capacity
Technologies and Innovation
- Ability to innovate
- Expenditure on research and development, patents
- New technologies
- New products in operation
- New technologies in production
Competitive Analysis in STRATEGY.APP
In the setup we enter all competitors that occur during the strategy development. The basic data usually relate to the same level as our own company; i.e. you describe an entire company or the division of a group.
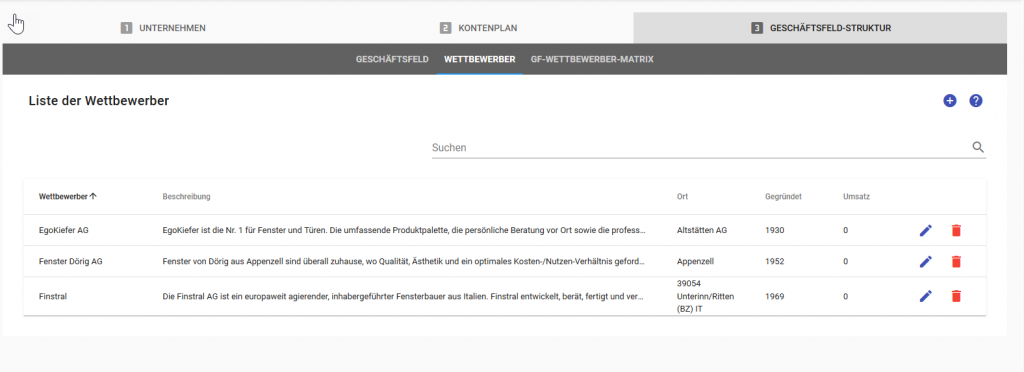
Then we assign the competitors from the overall list to the individual BU. The question is, where does a competitor in the market compete with us? With a simple click, a record is created for the corresponding BU. Only the name of the competitor is taken over. All other and further data are dealt with in the BU-strategy. If a competitor assignment is deleted, the record from the BU-strategy is deleted again.
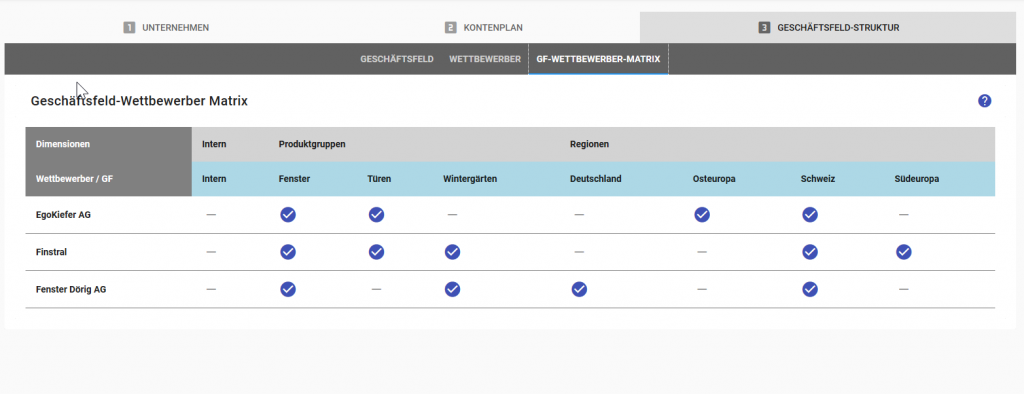
We can now analyze the competitors at the corporate level and / or at the business field level and derive SWOT elements for the SWOT. Here we show the procedure at the company level.
All competitors we’ve covered are listed at the company level. The description fields are taken from the configuration.
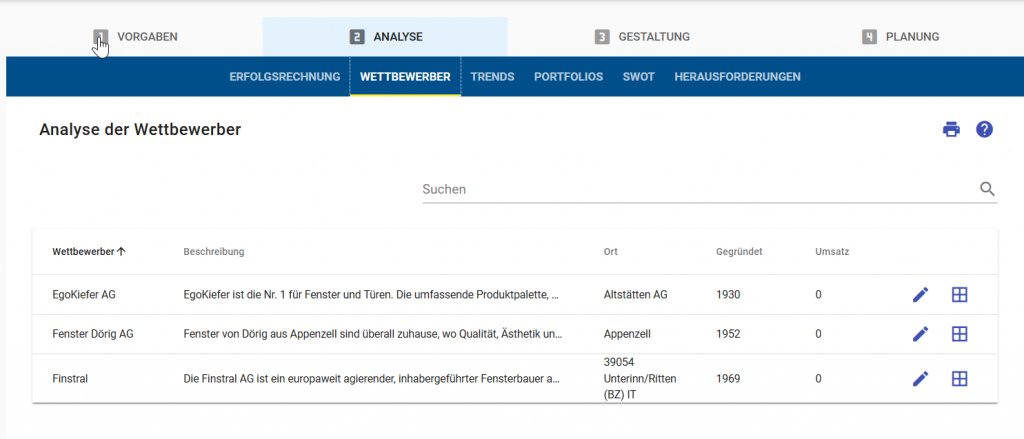
There are two dialog windows available:
- Edit: Enter and customize competitor data descriptions
- SWOT: Enter each of the competitor’s three strengths and weaknesses and the corresponding weaknesses and strengths of your company that they face.
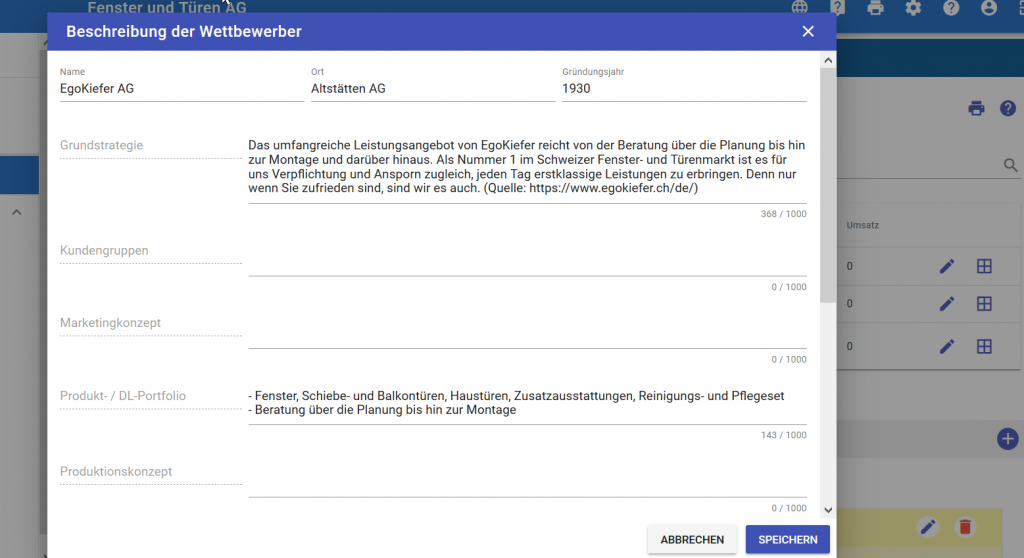
For each competitor, the 3 strengths are contrasted with our weaknesses and the 3 weaknesses are our strengths
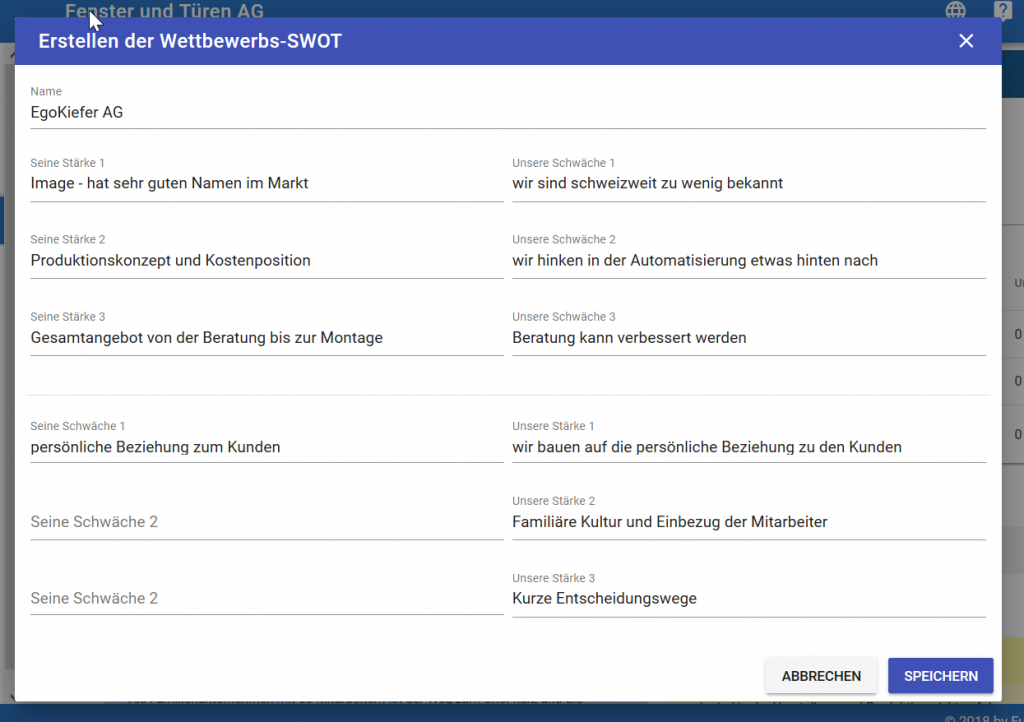
The same procedure can also be used for every business field.
Download the Competitive Analysis (pptx) tool