Whitepaper Adjacencies
The Adjacency method is based on a similar philosophy to the Ansoff matrix, but uses additional criteria. While the Ansoff matrix works with the dimensions product and market, the Adjacency method focuses on the dimensions distance to the core business and distance to success.
For the distance to the core business we take the two Ansoff criteria market and product and add the criteria technology, sales channel, regions, value chain (forward and backward integration) and applications.
For the dimension of distance to success, we work with criteria such as the level of necessary investment or duration until the first turnover.
Since the risk, and thus the probability of failure, increases with the distance to the existing business, the following rules apply:
- Develop new businesses in neighboring (adjacent) areas
- Do not develop new businesses in more than one dimension at the same time (for Ansoff, that would be diversification)
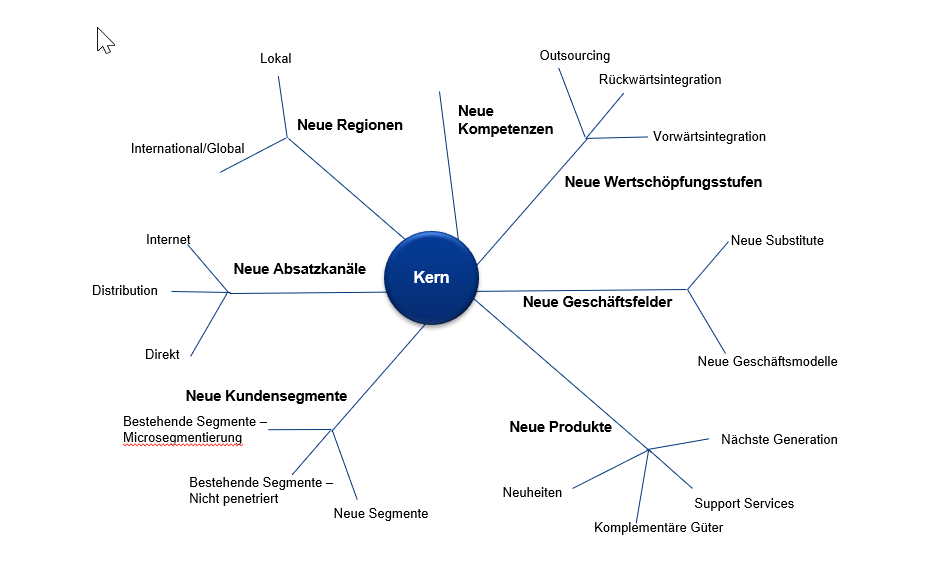
Figure 1: Expansion of the core business in multiple dimensions
The procedure is organized in the following steps:
- Definition of the core business
- Defining the criteria for the distance from the core business (Adjacency)
- Definition of criteria for the distance to success
- Development of strategic options (the marketplace method is suitable for this)
- Rating of adjacencies and distance to success for each strategic option
- Calculating the Adjacency Portfolio (see Excel Tool)
- Selection of options and development of strategic directions
Procedure:
1. Definition of the core business
In a first step, the core business is defined by the description of the business segments. You will find instructions on how to do this in the two whitepapers «Business Segment Structure» and «Business Segment Description».
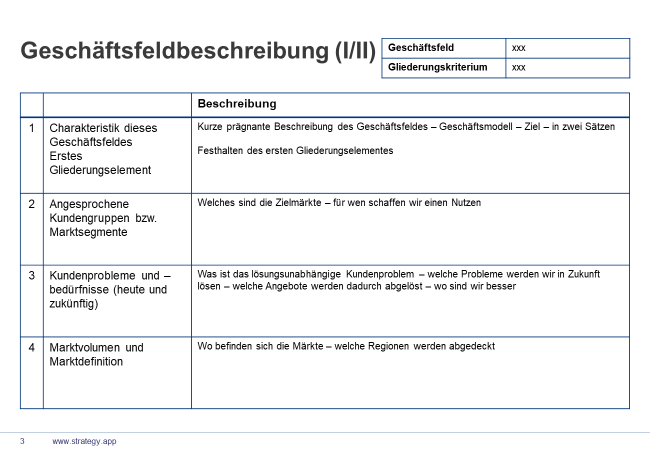
Figure 2: Business Field Description
2. Defining the criteria for the distance from the core business (Adjacency)
The criteria market / customer groups, products, technologies, sales channels and regions help us to measure the distance to our core business. If all are the same, we remain in our core business – the more of them are different, the further we move into new areas of business.
These criteria must be discussed, precisely defined and provided with a scale of values, e.g. with values from 1 to 3, which indicate the distance from the core business.
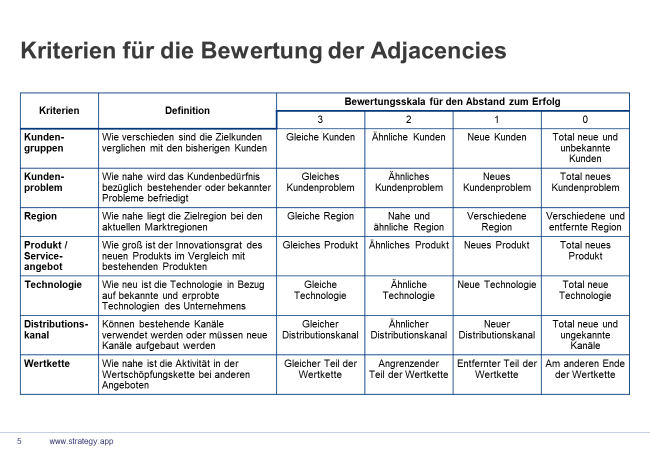
Figure 3: Definition of criteria for the dimension Adjacency
3. Definition of criteria for distance to success
Here we propose the following six criteria: Market size – Sales – Time to first sales – Competition – Substitution of existing products – Investments
These criteria should also be discussed, defined and provided with a scale of values, e.g. the expected market volume is evaluated with figures from 1 to 3.
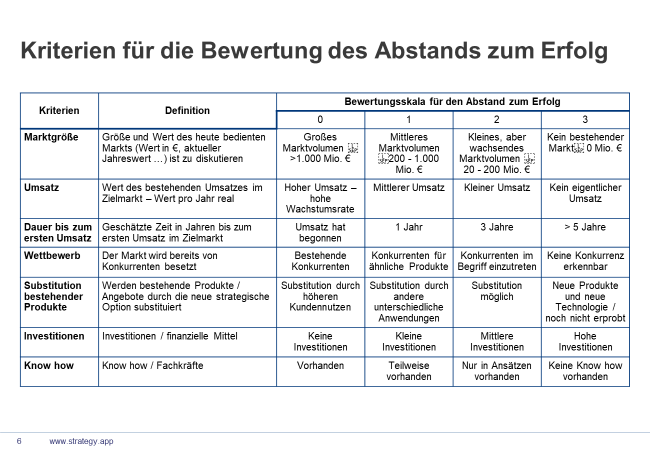
Figure 4: Description of the criteria for the distance to success
4. Developing Strategic Options
For the elaboration and compilation of strategic options and directions, we recommend the «Marketplace» method (we will also provide a whitepaper on this shortly). However, other methods can also be used here, such as brainstorming or systematic derivation from SWOT analysis. Or we can use simple forms to search for potentials in any direction (dimension).
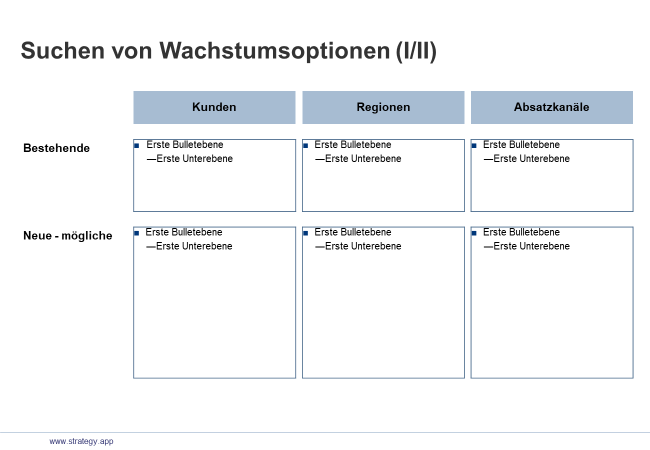
Figure 5: Developing strategic options
5. Assessment of adjacencies and distance to success for each strategic option
For each idea or option, the distance to the core business and the distance to success are evaluated based on the given criteria. A brief description of the discussion will help with later use or revision.
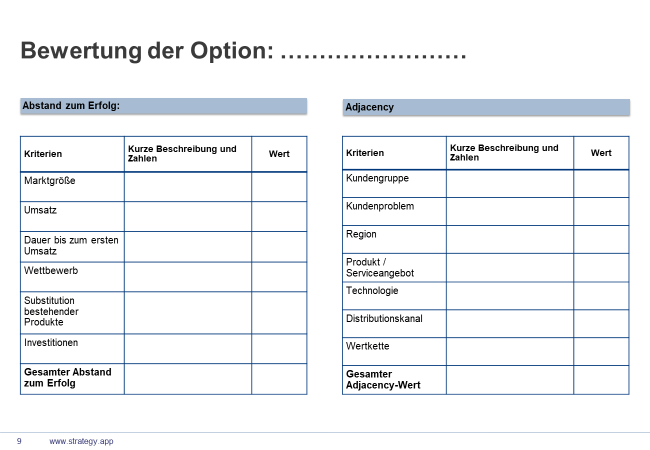
Figure 6: Assessment of the strategic options
6. Calculating the Adjacency Portfolio (see Excel Tool)
We provide you with an Excel tool for calculating the portfolio. The result shows at a glance the risk positions of the individual options, from the expansion of the core business to diversification which is totally different from the existing business.
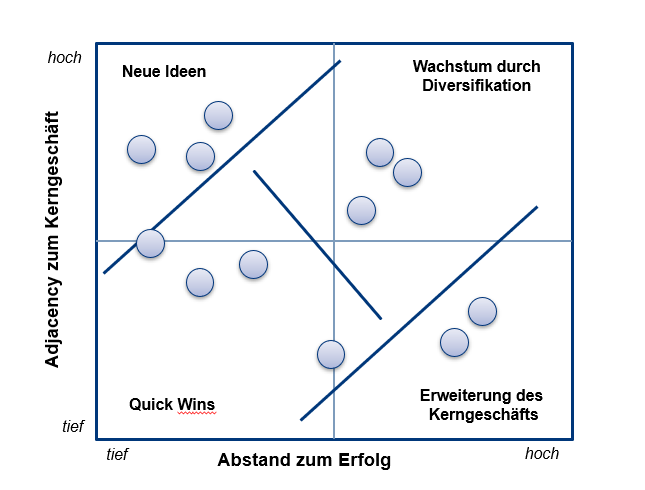
Figure 7: Rating of options (Excel tool or directly in STRATEGY.APP)
7. Selection of options and description of strategic directions
The risk portfolio can be used to divide up and prioritise the strategy directions.
The matrix can be roughly divided into 4 fields:
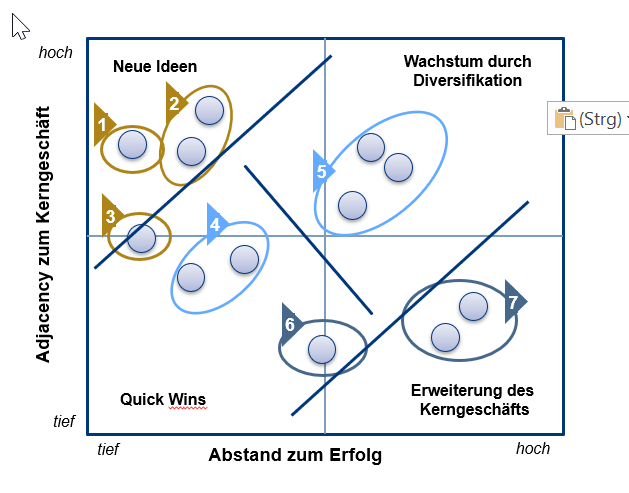
- Close to the core business and close to success (bottom left):
- These are the Quick-Wins. They can be implemented quickly and are in the core business. Often these are not big strategies, but rather immediate measures.
- Close to the core business, but big distance to success (bottom right):
- This is the strategic expansion of the core business. New, partly large and therefore strategic investments in the existing business. This includes, for example, the construction of a new factory.
- Far from the core business with a small distance to success (top left):
- These are often ideas for new business in the form of tests or pilot projects. Sometimes the effort is simply underestimated here. Nevertheless, it may be useful to launch targeted experiments or to try something without investing too much. This allows the risk to be kept under control.
- Far from the core business with a big distance to success (top right):
- This is real diversification. This not only involves a high risk, but also has a considerable cost. We recommend that you take another close look at these options and only tackle them after weighing up all the risks and arguments.
The preparation of a business plan and a risk assessment can now be built on this basis.
Assessment of strategic options with Adjacency in STRATEGY.APP
In STRATEGY.APP, the criteria for the Adjacencies tool are set in the parameters for the instruments:
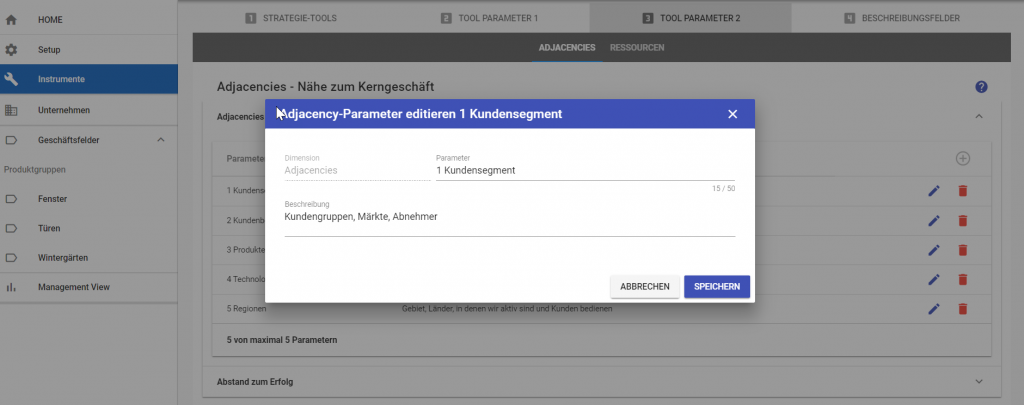
Figure 9: Input of the parameters for Adjacency
The strategic options that we have developed are therefore evaluated individually:
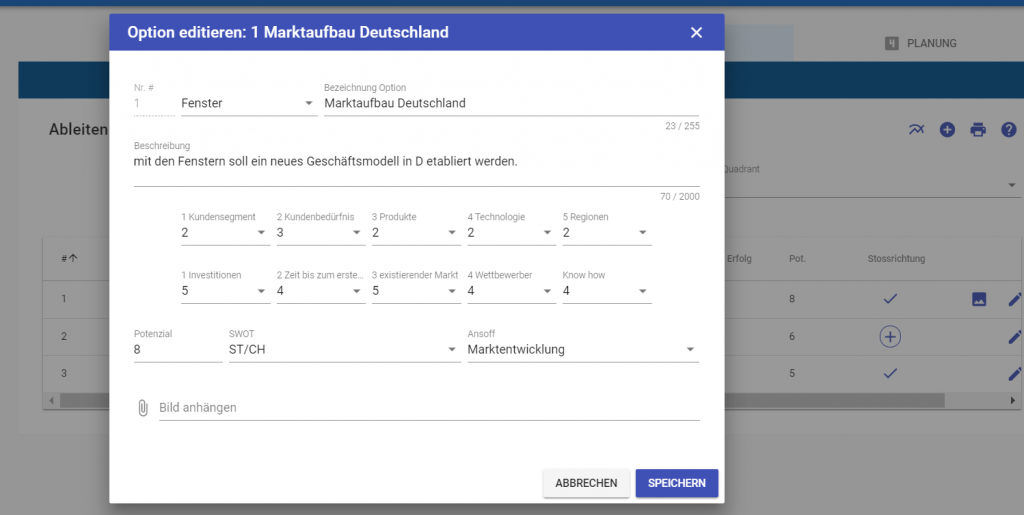
Figure 10: Rating of the individual options
The evaluation shows the position of the options on the adjacency matrix:
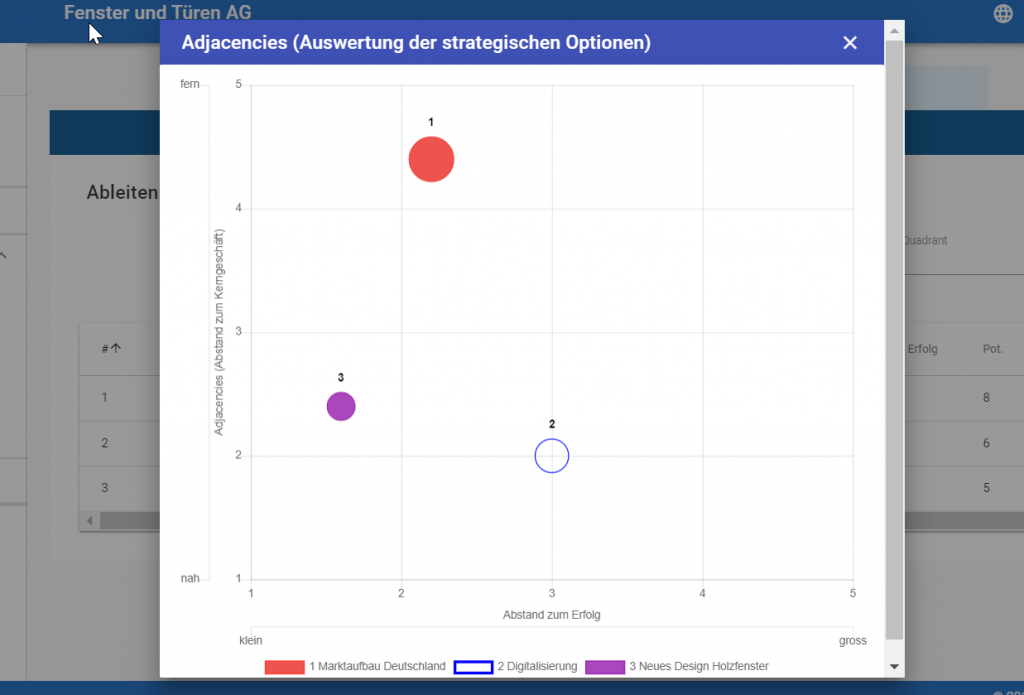
Figure 11: Position of the options on the adjacency matrix
Then the options for further processing are selected and described and quantified as strategic directions.
Note: Agility
Here is a note on the subject of agility: STRATEGY.APP allows new options to be added at any time, and new directions to be created from the options. On the other hand, running strategic directions can be stopped or reset at any time. The business plan and the measures are then automatically adjusted or removed. This makes it possible to react to changes in the environment at any time.
We have prepared a practical tool (xls) and a template for PowerPoint for you to download:
Download Adjacenciy example (xlsx)
Download Adjacency PPT Template
Adjacencies
Die Adjacency-Methode beruht auf einer ähnlichen Philosophie wie die Ansoff-Matrix, benutzt aber zusätzliche Kriterien. Während die Ansoff-Matrix mit den Dimensionen Produkt und Markt arbeitet, stehen bei der Adjacency-Methode die Dimensionen Abstand zum Kerngeschäft und Abstand zum Erfolg im Mittelpunkt.
Für den Abstand zum Kerngeschäft nehmen wir die beiden Ansoff-Kriterien Markt und Produkt und ergänzen diese um die Bereiche Technologie, Absatzkanal, Regionen, Wertschöpfungskette (Vorwärts- und Rückwärtsintegration), Anwendungen und evtl. noch weitere.
Für die Dimension Abstand zum Erfolg arbeiten wir mit Kriterien wie z.B. Höhe der notwendigen Investitionen oder Dauer bis zum ersten Umsatz.
Da das Risiko und damit die Wahrscheinlichkeit für einen Misserfolg mit der Distanz zum bestehenden Geschäft grösser werden, gelten folgende Regeln:
- Entwickle neue Geschäfte in benachbarten (anliegend = adjacent) Bereichen
- Entwickle neue Geschäfte nicht gleichzeitig in mehr als einer Dimension (bei Ansoff wäre das die Diversifikation)
Abbildung 1: Ausbau des Kerngeschäfts in verschieden Dimensionen
Das Vorgehen gliedert sich in folgende Schritte:
- Definition des Kerngeschäfts
- Festlegen der Kriterien für den Abstand vom Kerngeschäft (Adjacency)
- Definition der Kriterien für den Abstand zum Erfolg
- Entwickeln von strategischen Optionen (dazu eignet sich die Marktplatz-Methode)
- Bewertung von Adjacencies und Abstand zum Erfolg für jede strategische Option
- Berechnen des Adjacency-Portfolios (siehe Excel-Werkzeug)
- Auswahl der Optionen und Ausarbeitung der strategischen Stossrichtungen
Vorgehen:
1. Definition des Kerngeschäftes
In einem ersten Schritt wird das Kerngeschäft durch die Beschreibung der Geschäftsfelder festgelegt. Eine Anleitung dazu finden Sie in den beiden Whitepapers «Geschäftsfeldgliederung» und «Geschäftsfeldbeschreibung».
Abbildung 2: Geschäftsfeldbeschreibung
2. Festlegen der Kriterien für den Abstand vom Kerngeschäft (Adjacency)
Die Kriterien Markt / Kundengruppen, Produkte, Technologien, Absatzkanäle und Regionen helfen uns, den Abstand zum Kerngeschäft zu messen. Sind alle gleich, bleiben wir im Kerngeschäft – je mehr davon neu sind, desto weiter bewegen wir uns weg.
Diese Kriterien gilt es zu diskutieren, genau zu definieren und mit einer Werteskala zu versehen, z.B. mit Werten von 1 bis 3, mit denen der Abstand vom Kerngeschäft angegeben wird.
Abbildung 3: Festlegen der Kriterien für die Dimension Adjacency
3. Definition der Kriterien für den Abstand zum Erfolg
Hier schlagen wir die folgenden sechs Kriterien vor: Marktgrösse – Umsatz – Dauer bis zum ersten Umsatz – Wettbewerb – Substitution bestehender Produkte – Investitionen
Auch diese Kriterien sollen diskutiert, definiert und mit einer Werteskala versehen werden, z.B. wird das zu erwartende Marktvolumen mit Zahlen von 1 bis 3 bewertet.
Abbildung 4: Beschreibung der Kriterien für den Abstand zum Erfolg
4. Entwickeln von strategischen Optionen
Für die Ausarbeitung und das Zusammenstellen der strategischen Optionen und Stossrichtungen empfehlen wir die Methode „Marktplatz“ (auch dazu werden wir in Kürze ein Whitepaper zur Verfügung stellen). Aber auch andere Methoden können hier zum Einsatz kommen, wie z.B. das Brainstorming oder die systematische Ableitung aus der SWOT-Analyse. Oder wir verwenden einfache Formulare, mit denen Potenziale in jede Richtung (Dimension) gesucht werden.
Abbildung 5: Erarbeiten von strategischen Optionen
5. Bewertung von Adjacencies und Abstand zum Erfolg für jede strategische Option
Für jede Idee oder jede Option wird jetzt der Abstand zum Kerngeschäft und der Abstand zum Erfolg anhand der vorgegebenen Kriterien bewertet. Eine kurze Beschreibung der Diskussion hilft beim späteren Gebrauch oder bei einer Überarbeitung.
Abbildung 6: Bewertung der strategischen Optionen
6. Berechnen des Adjacency-Portfolios (siehe Excel-Werkzeug)
Zur Berechnung des Portfolios stellen wir Ihnen ein Excel-Werkzeug zur Verfügung. Das Resultat zeigt auf einen Blick die Risikopositionen der einzelnen Optionen auf, vom Ausbau des Kerngeschäftes bis zur Diversifikation, die nichts mehr mit dem bestehenden Geschäft zu tun hat.
Abbildung 7: Bewertung der Optionen (Excel-Tool oder direkt in STRATEGY.APP)
7. Auswahl der Optionen und Beschreibung der strategischen Stossrichtungen
Anhand des Risiko-Portfolios lassen sich die Stossrichtungen aufteilen und priorisieren.
Die Matrix lässt sich grob in 4 Felder unterteilen:
- Nahe am Kerngeschäft und kleiner Abstand zum Erfolg (unten links):
- Dies sind die Quick-Wins. Sie können schnell umgesetzt werden und befinden sich im Kerngeschäft. Vielfach sind das dann auch keine grossen Strategien, sondern eher Sofortmassnahmen
- Nahe am Kerngeschäft, aber grosser Abstand zum Erfolg (unten rechts):
- Dies ist der strategische Ausbau des Kerngeschäfts. Neue, teilweise grosse und daher eben strategische Investitionen ins bestehende Geschäft. Darunter fällt z.B. der Bau einer neuen Fabrik.
- Fern vom Kerngeschäft mit kleinem Abstand zum Erfolg (links oben):
- Das sind vielfach Ideen für neue Geschäfte in der Form von Tests oder Pilotprojekten. Manchmal wird hier der Aufwand ganz einfach unterschätzt. Trotzdem kann es sinnvoll sein, gezielt Versuche zu starten oder etwas auszuprobieren, ohne zu viel zu investieren. Damit kann das Risiko unter Kontrolle gehalten werden.
- Fern vom Kerngeschäft mit grossem Abstand zum Erfolg (rechts oben):
- Hier handelt es sich um wirkliche Diversifikation. Diese birgt nicht nur ein hohes Risiko in sich, sondern kostet auch einiges. Wir empfehlen, diese Optionen noch einmal genau unter die Lupe zu nehmen und erst nach Abwägung aller Risiken und Argumente anzugehen.
Die Ausarbeitung eines Businessplans und einer Risikobetrachtung kann jetzt auf dieser Basis aufbauen.
Bewertung der strategischen Optionen mit Adjacency in STRATEGY.APP
In STRATEGY.APP werden die Parameter für das Tool Adjacencies in den Parametern für die Instrumente vorgegeben:
Abbildung 9: Eingabe der Parameter für Adjacency
Die strategischen Optionen, die wir erarbeitet haben, werden demgemäss einzeln bewertet:
Abbildung 10: Bewertung der einzelnen Optionen
Die Auswertung zeigt die Position der Optionen auf der Adjacency-Matrix an:
Abbildung 11: Position der Optionen auf der Adjacency-Matrix
Danach werden die Optionen für die weitere Bearbeitung ausgewählt und als Stossrichtungen beschrieben und quantifiziert.
Hinweis: Agilität
Hier noch ein Hinweis auf das Thema Agilität: STRATEGY.APP erlaubt es einerseits, jederzeit neue Optionen aufzunehmen, aus den Optionen neue Stossrichtungen aufzubauen. Andererseits können laufende Stossrichtungen jederzeit gestoppt oder zurückgestellt werden. Der Businessplan und die Massnahmen werden dann automatisch angepasst bzw. herausgenommen. Damit kann jederzeit auf Veränderungen im Umfeld reagiert werden.
Wir haben für Sie hier ein praktisches Tool (xls) sowie eine Vorlage für Power-Point vorbereitet, die Sie herunterladen können: